Technical Analysis of VOD 2024-05-10
Overview:
In analyzing the technical indicators for VOD over the last 5 days, we will delve into the trend, momentum, volatility, and volume indicators to provide a comprehensive outlook on the possible stock price movement. By examining these key aspects, we aim to offer valuable insights and predictions for the upcoming days.
Trend Analysis:
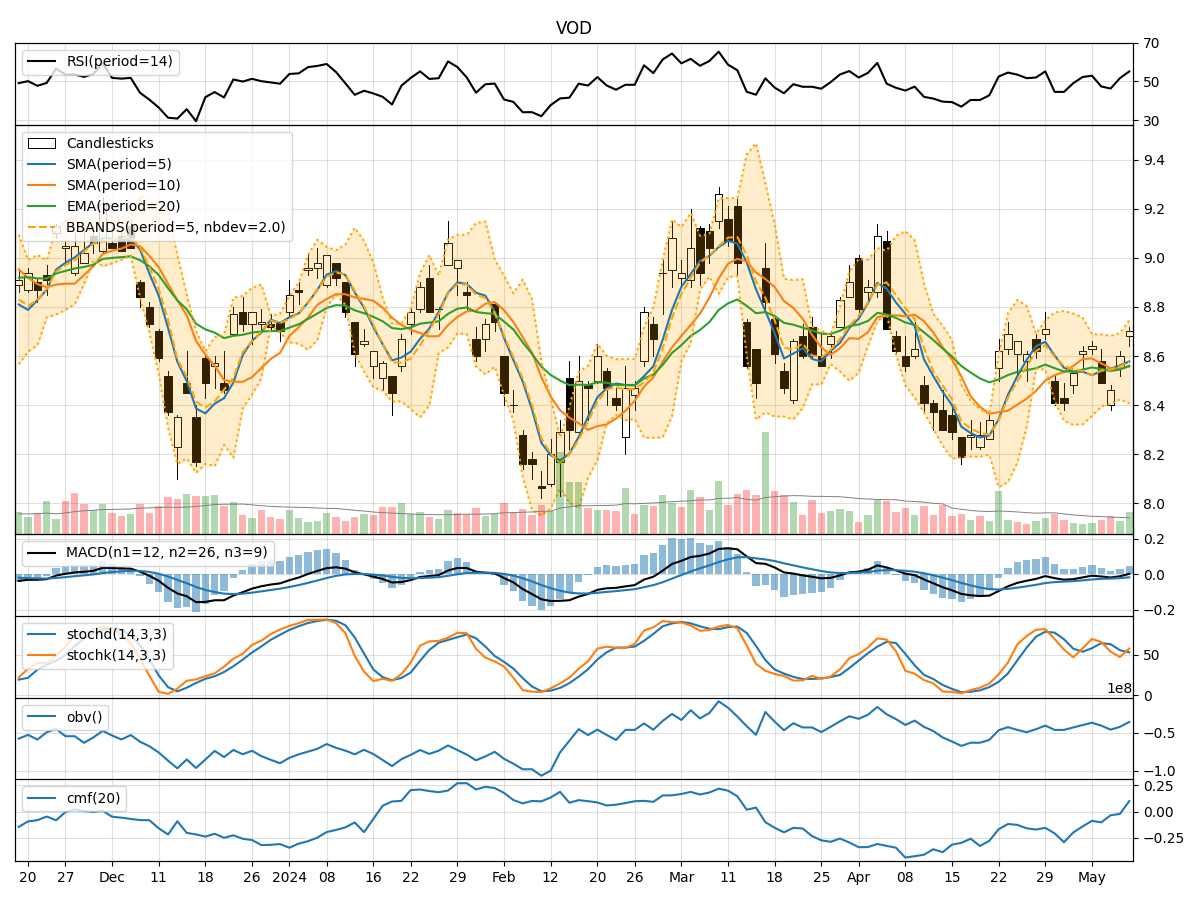
- Moving Averages (MA): The 5-day MA has been fluctuating around the closing prices, indicating short-term price trends. The SMA(10) and EMA(20) have shown a slight downward trend, suggesting a potential bearish sentiment.
- MACD: The MACD line has been negative, with the MACD histogram showing a decreasing trend. This indicates a bearish momentum in the stock price.
- RSI: The RSI has been hovering around the neutral zone, indicating a lack of strong buying or selling pressure.
Momentum Analysis:
- Stochastic Oscillator: The Stochastic Oscillator has been fluctuating, but the %K and %D lines have not shown any clear direction. This suggests a lack of strong momentum in either direction.
- Williams %R: The Williams %R has been oscillating near oversold levels, indicating a potential buying opportunity.
Volatility Analysis:
- Bollinger Bands (BB): The Bollinger Bands have been narrowing, indicating decreasing volatility in the stock price. This could signal a period of consolidation or a potential breakout in the near future.
Volume Analysis:
- On-Balance Volume (OBV): The OBV has been fluctuating, but the overall trend has been relatively flat. This suggests a balance between buying and selling pressure.
- Chaikin Money Flow (CMF): The CMF has been negative, indicating a slight outflow of money from the stock.
Key Observations:
- The trend indicators suggest a bearish sentiment in the short term.
- Momentum indicators show a lack of strong momentum in either direction.
- Volatility is decreasing, indicating a potential period of consolidation.
- Volume indicators point to a balanced buying and selling pressure.
Conclusion:
Based on the analysis of the technical indicators, the stock price of VOD is likely to experience further downward movement in the next few days. The bearish trend, lack of strong momentum, decreasing volatility, and balanced volume all point towards a potential continuation of the current downward trend. Traders and investors should exercise caution and consider short-term selling strategies in line with the prevailing market dynamics.