Technical Analysis of VINC 2024-05-31
Overview:
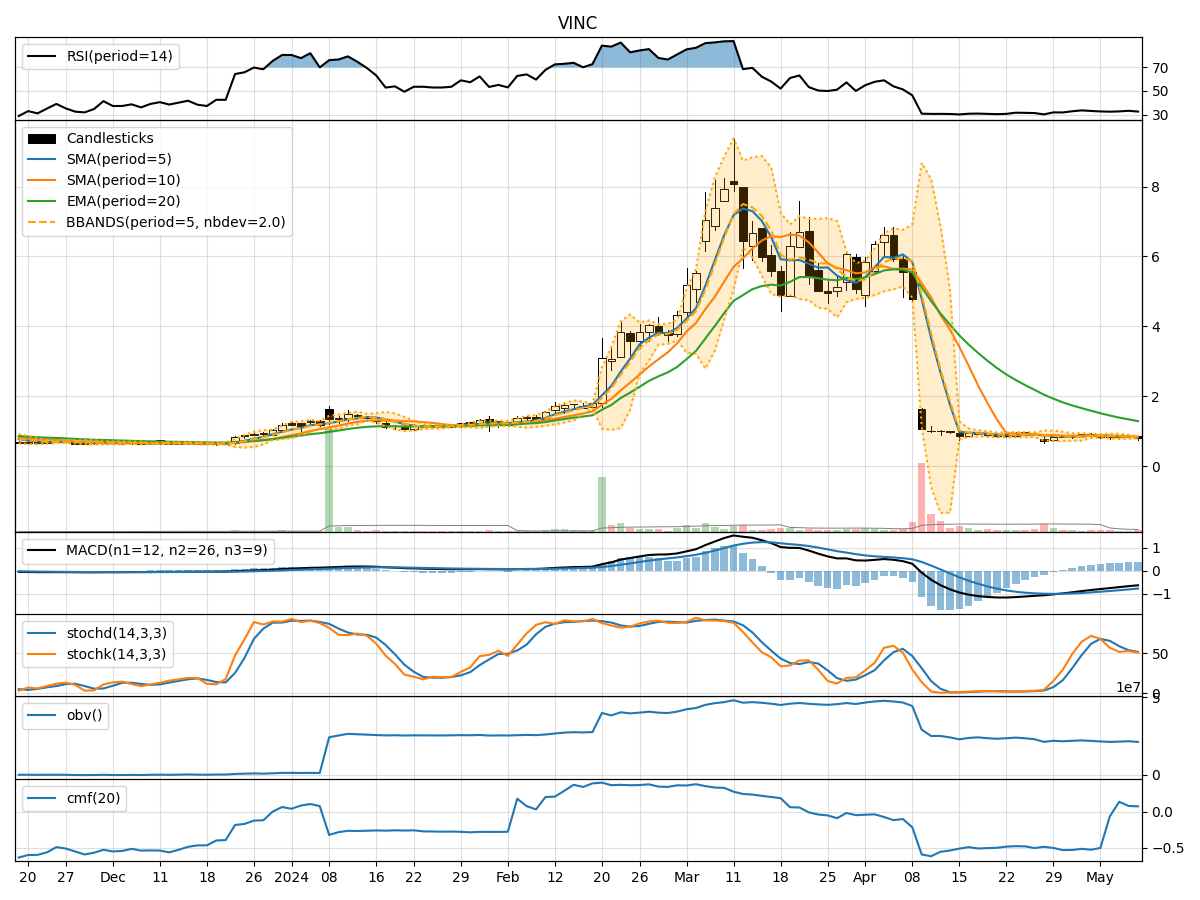
In analyzing the technical indicators for VINC over the last 5 days, we will delve into the trend, momentum, volatility, and volume indicators to provide a comprehensive outlook on the possible stock price movement in the coming days.
Trend Analysis:
- Moving Averages (MA): The 5-day MA has been consistently below the closing price, indicating a downward trend.
- MACD: The MACD line has been negative, with the MACD histogram showing a decreasing trend, signaling bearish momentum.
- EMA: The EMA has been declining, further supporting the bearish trend.
Momentum Analysis:
- RSI: The RSI has been below 50, indicating bearish momentum.
- Stochastic Oscillator: Both %K and %D have been in oversold territory, suggesting a potential reversal.
- Williams %R: The indicator has been in oversold territory, signaling a possible bounce back.
Volatility Analysis:
- Bollinger Bands (BB): The stock price has been trading below the lower Bollinger Band, indicating oversold conditions.
- Bollinger Band Width: The BB width has been widening, suggesting increased volatility.
- Bollinger Band %B: The %B has been below 0.2, indicating an oversold condition.
Volume Analysis:
- On-Balance Volume (OBV): The OBV has been declining, reflecting selling pressure.
- Chaikin Money Flow (CMF): The CMF has been negative, indicating outflow of money from the stock.
Key Observations:
- The stock is currently in a downtrend based on moving averages and MACD.
- Momentum indicators suggest a potential reversal due to oversold conditions.
- Volatility indicators point towards increased volatility and oversold conditions.
- Volume indicators reflect selling pressure and negative money flow.
Conclusion:
Based on the analysis of technical indicators, the next few days for VINC are likely to see a potential reversal in the stock price. The oversold conditions indicated by momentum and volatility indicators, along with the possibility of a bounce back suggested by Williams %R, may lead to a short-term upward movement in the stock price. However, it is essential to monitor the price action closely for confirmation of a trend reversal.