Technical Analysis of VERA 2024-05-31
Overview:
In analyzing the provided VERA TA data for the last 5 days, we will delve into the technical indicators across trend, momentum, volatility, and volume to forecast the possible stock price movement in the upcoming days. By examining these indicators comprehensively, we aim to provide a well-informed prediction backed by data-driven insights and expert analysis.
Trend Analysis:
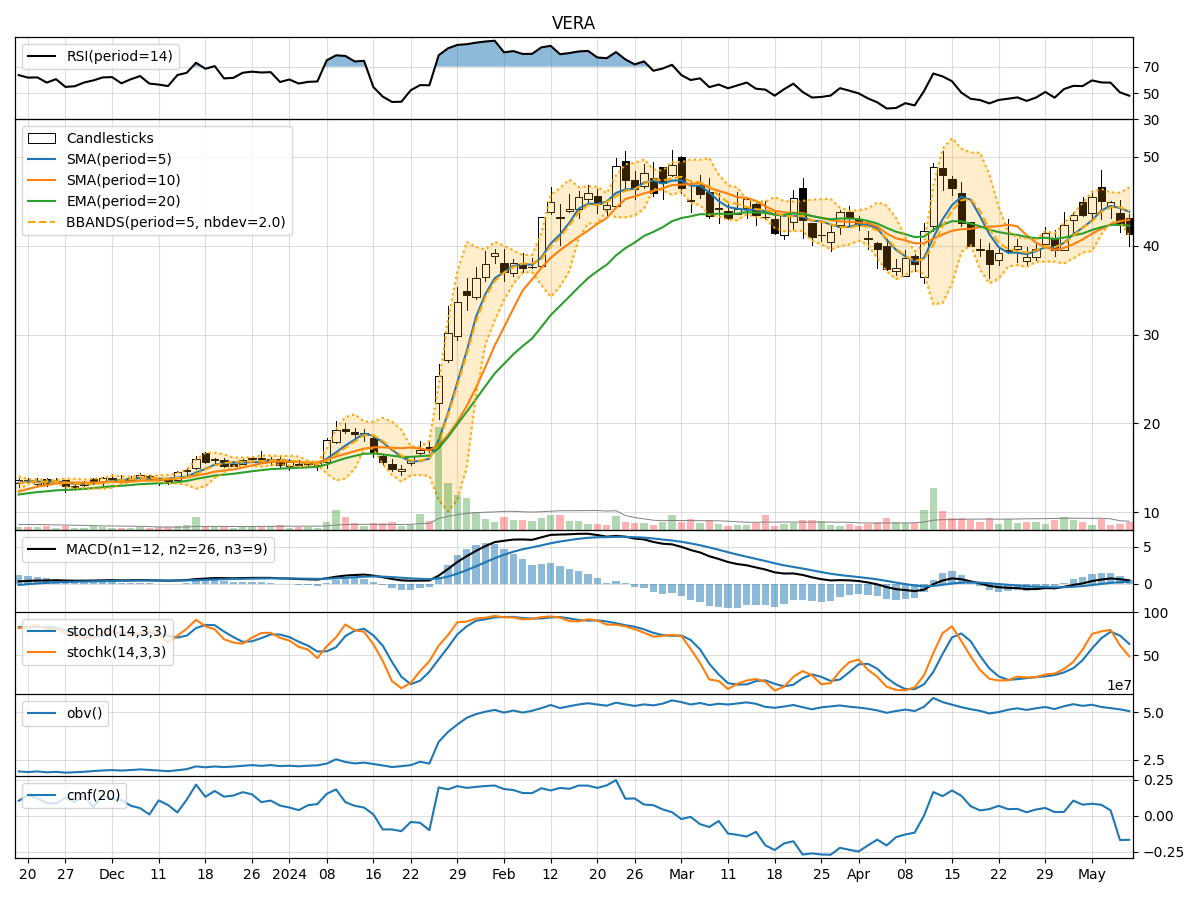
- Moving Averages (MA): The 5-day MA has been consistently below the 10-day SMA, indicating a short-term bearish trend.
- Exponential Moving Average (EMA): The EMA has been declining, suggesting a weakening trend.
- Moving Average Convergence Divergence (MACD): The MACD and its signal line have been negative, signaling a bearish momentum.
Momentum Analysis:
- Relative Strength Index (RSI): The RSI has been relatively low, indicating potential oversold conditions.
- Stochastic Oscillator (Stoch): Both %K and %D have been rising but remain in oversold territory.
- Williams %R (WillR): The Williams %R is also in oversold territory, suggesting a possible reversal.
Volatility Analysis:
- Bollinger Bands (BB): The stock price has been trading below the lower Bollinger Band, indicating oversold conditions.
Volume Analysis:
- On-Balance Volume (OBV): The OBV has been declining, reflecting selling pressure.
- Chaikin Money Flow (CMF): The CMF has been negative, indicating outflows from the stock.
Key Observations:
- The stock is currently in a downtrend based on moving averages and MACD.
- Momentum indicators suggest the stock may be oversold and due for a potential reversal.
- Volatility indicators show the stock is in oversold territory based on Bollinger Bands.
- Volume indicators reflect selling pressure as OBV and CMF are negative.
Conclusion:
Based on the analysis of the technical indicators, the stock is currently in a downtrend with oversold conditions. However, the momentum indicators suggest a potential reversal in the near future. Considering the oversold levels in momentum and volatility indicators, there is a possibility of a short-term bounce or recovery in the stock price. Traders may consider buying opportunities for a potential upward movement in the coming days. It is crucial to monitor the price action closely for any signs of bullish reversal confirmation.