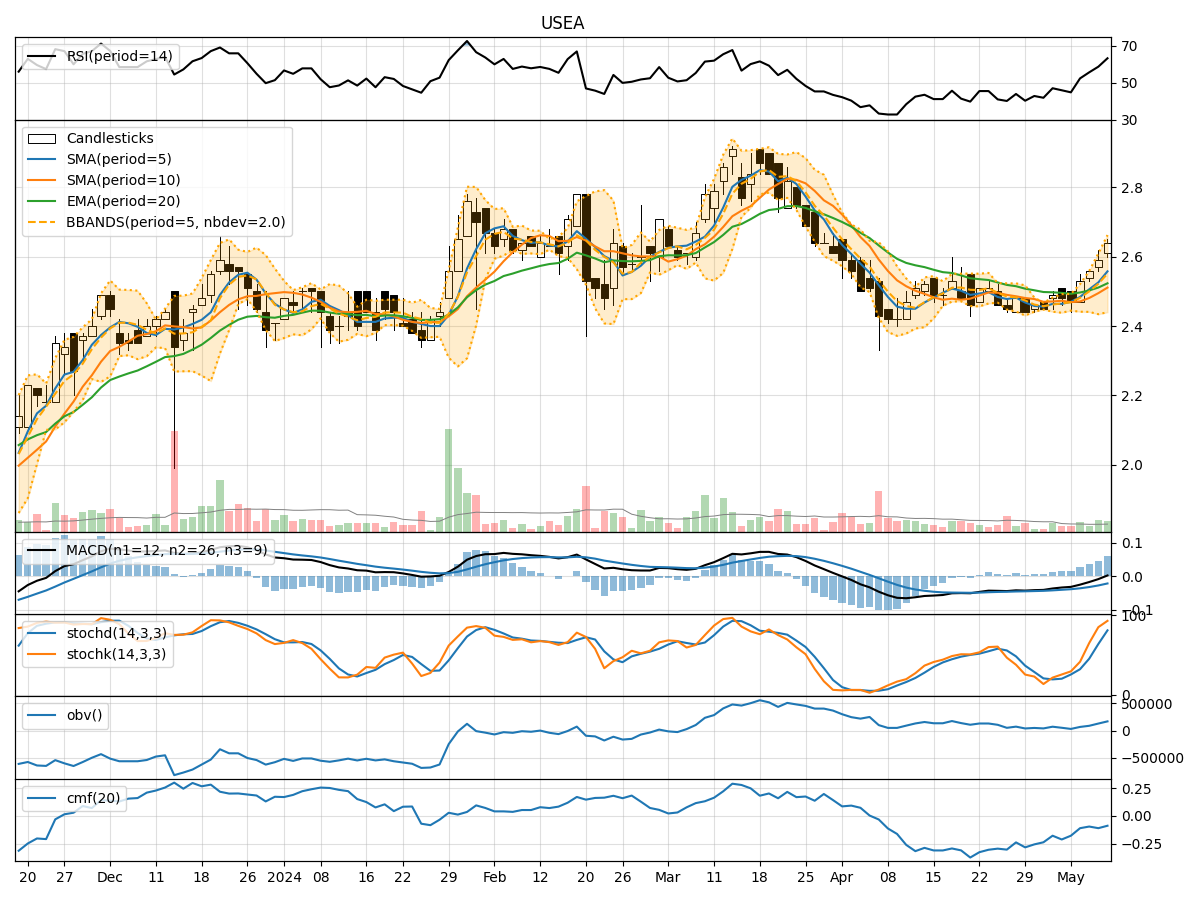
Technical Analysis of USEA 2024-05-10
Overview:
In the last 5 trading days, USEA stock has shown a gradual increase in closing prices, accompanied by fluctuating trading volumes. The trend indicators suggest a positive momentum with moving averages and MACD showing an upward trend. Momentum indicators like RSI and Stochastic oscillators indicate a strengthening bullish sentiment. Volatility indicators show expanding Bollinger Bands, indicating increased price fluctuation potential. Volume indicators like OBV and CMF suggest a mixed sentiment with a slight negative bias.
Trend Analysis:
- Moving Averages (MA): The 5-day moving average has been consistently rising, indicating a bullish trend.
- MACD: The MACD line has been increasing, crossing above the signal line, signaling a bullish momentum.
- EMA: The exponential moving average has been trending upwards, supporting the bullish sentiment.
Momentum Analysis:
- RSI: The RSI has been increasing and is now in the neutral zone, suggesting a potential for further upside.
- Stochastic Oscillators: Both %K and %D have been rising, indicating strong bullish momentum.
- Williams %R: The indicator has moved from oversold to a more neutral position, signaling a potential reversal.
Volatility Analysis:
- Bollinger Bands (BB): The bands have been widening, indicating increased price volatility.
- BB %B: The %B indicator is above 0.5, suggesting a bullish bias in the short term.
Volume Analysis:
- On-Balance Volume (OBV): The OBV has been increasing, indicating accumulation by investors.
- Chaikin Money Flow (CMF): The CMF has been negative, suggesting some distribution in the stock.
Key Observations:
- The stock is in a clear uptrend based on moving averages and MACD.
- Momentum indicators like RSI and Stochastic oscillators support a bullish view.
- Volatility is increasing, which could lead to larger price swings.
- Volume indicators show a mixed sentiment, with OBV indicating accumulation but CMF showing distribution.
Conclusion:
Based on the technical analysis of trend, momentum, volatility, and volume indicators, the next few days are likely to see further upward movement in USEA stock price. The bullish trend supported by moving averages, MACD, RSI, and Stochastic indicators suggests a positive outlook. However, investors should be cautious of the increasing volatility and monitor volume trends closely for any signs of reversal. Overall, the technical analysis points towards a bullish bias in the upcoming days.