Technical Analysis of UPC 2024-05-10
Overview:
In analyzing the technical indicators for UPC stock over the last 5 days, we will delve into the trend, momentum, volatility, and volume indicators to provide a comprehensive outlook on the possible stock price movement in the upcoming days. By examining these key indicators, we aim to offer valuable insights and recommendations for potential investors.
Trend Analysis:
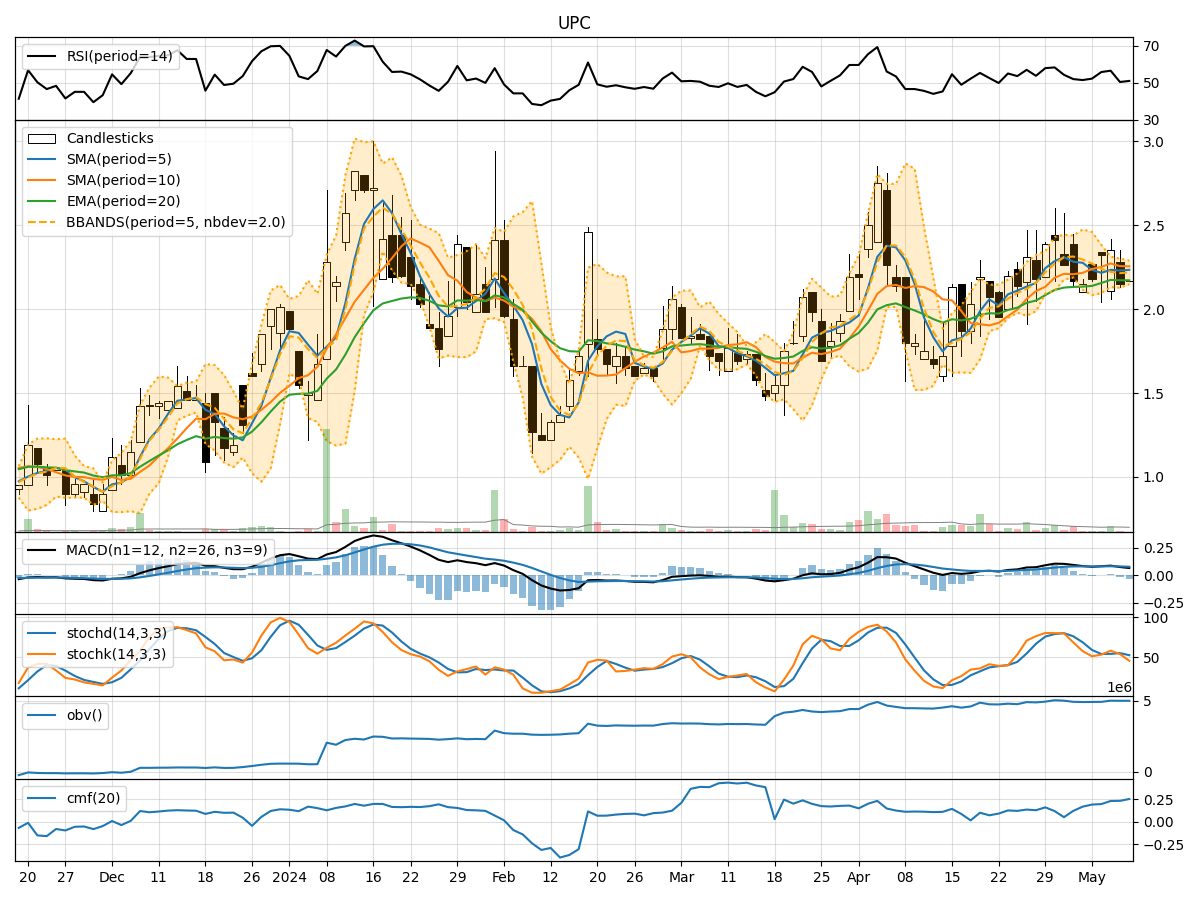
- Moving Averages (MA): The 5-day Moving Average (MA) has been fluctuating around the current stock price, indicating a lack of clear trend direction.
- MACD: The Moving Average Convergence Divergence (MACD) has shown a slight decrease over the past few days, suggesting a potential weakening of the bullish momentum.
- EMA: The Exponential Moving Average (EMA) has been relatively stable, reflecting a consistent trend in the stock price.
Key Observation: The trend indicators suggest a neutral to slightly bearish sentiment in the short term.
Momentum Analysis:
- RSI: The Relative Strength Index (RSI) has been hovering around the 50 level, indicating a balanced momentum between buying and selling pressure.
- Stochastic Oscillator: Both %K and %D of the Stochastic Oscillator have shown a decline, signaling a potential shift towards oversold conditions.
- Williams %R: The Williams %R is in the oversold territory, suggesting a possible reversal in the stock price.
Key Observation: Momentum indicators point towards a bearish bias in the short term.
Volatility Analysis:
- Bollinger Bands: The Bollinger Bands have shown a narrowing of the bands, indicating decreasing volatility in the stock price.
- Bollinger %B: The %B indicator is below 1, suggesting that the stock price is trading below the upper Bollinger Band.
- Average True Range (ATR): The ATR has decreased, indicating a reduction in price volatility.
Key Observation: Volatility indicators signal a decrease in volatility and a potential period of consolidation.
Volume Analysis:
- On-Balance Volume (OBV): The OBV has shown a slight increase, indicating a positive accumulation of volume in the stock.
- Chaikin Money Flow (CMF): The CMF has been on an upward trend, suggesting that money is flowing into the stock.
Key Observation: Volume indicators reflect a positive sentiment with increasing accumulation and money flow into the stock.
Conclusion:
Based on the analysis of the technical indicators, the stock price of UPC is likely to experience further downward movement in the next few days. The trend indicators show a neutral to slightly bearish outlook, while momentum indicators indicate a bearish bias. Volatility indicators suggest a period of consolidation, and volume indicators point towards positive accumulation and money flow.
Key Conclusion: The overall technical analysis indicates a bearish sentiment for UPC stock in the short term. Investors should exercise caution and consider potential downside risks in their trading decisions.