Technical Analysis of UK 2024-05-10
Overview:
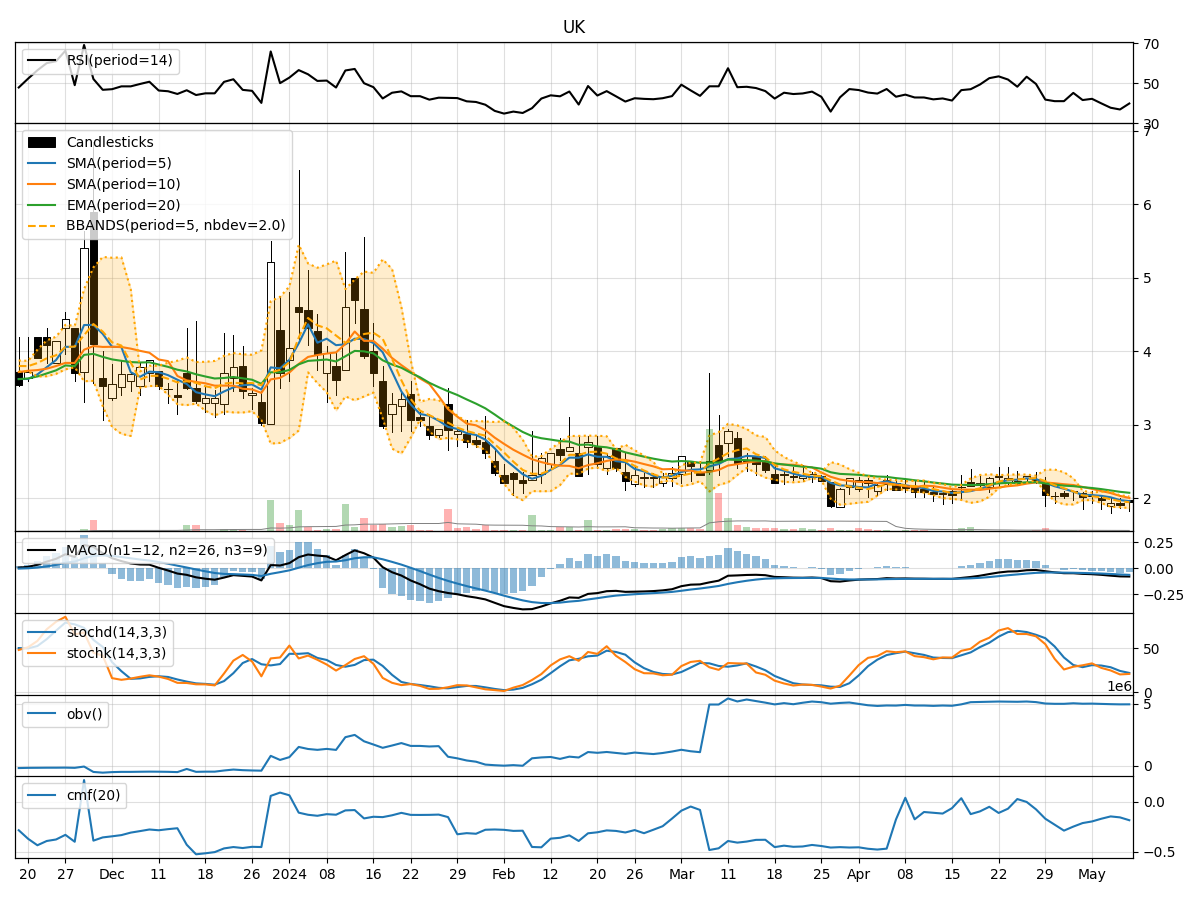
In analyzing the technical indicators for the UK stock over the last 5 days, we will delve into the trends, momentum, volatility, and volume indicators to provide a comprehensive outlook on the possible stock price movement in the coming days. By examining these key indicators, we aim to offer valuable insights and predictions for potential investors and traders.
Trend Analysis:
- Moving Averages (MA): The 5-day MA has been consistently decreasing, indicating a downward trend in the stock price.
- MACD: The MACD line has been negative and decreasing, suggesting a bearish momentum in the stock.
- EMA: The EMA has also been declining, reinforcing the bearish sentiment in the stock.
Momentum Analysis:
- RSI: The RSI has been decreasing and is currently below 50, indicating a bearish momentum in the stock.
- Stochastic Oscillator: Both %K and %D have been decreasing, signaling a bearish trend in the stock price.
- Williams %R: The indicator is in the oversold territory, suggesting a potential reversal or continuation of the bearish trend.
Volatility Analysis:
- Bollinger Bands (BB): The bands have been narrowing, indicating decreasing volatility in the stock price.
- BB %B: The %B is below 0.2, suggesting that the stock is oversold and may see a potential reversal.
Volume Analysis:
- On-Balance Volume (OBV): The OBV has been decreasing, indicating selling pressure in the stock.
- Chaikin Money Flow (CMF): The CMF has been negative, reflecting a bearish sentiment in the stock.
Key Observations:
- The stock is currently in a downtrend based on the moving averages and MACD.
- Momentum indicators such as RSI and Stochastic Oscillator suggest a bearish sentiment in the stock.
- Volatility has been decreasing, indicating a potential consolidation phase.
- The volume indicators show selling pressure in the stock.
Conclusion:
Based on the analysis of the technical indicators, the next few days are likely to see a continuation of the bearish trend in the stock price. Investors should exercise caution and consider waiting for a potential reversal signal before considering any long positions. The stock is currently in a downtrend with increased selling pressure and decreasing volatility. It is advisable to closely monitor the price action and key support levels for any potential trading opportunities.