Technical Analysis of TSLA 2024-05-10
Overview:
In analyzing the technical indicators for TSLA over the last 5 days, we will delve into the trend, momentum, volatility, and volume indicators to provide a comprehensive outlook on the possible stock price movement. By examining these key aspects, we aim to offer valuable insights and predictions for the upcoming days.
Trend Analysis:
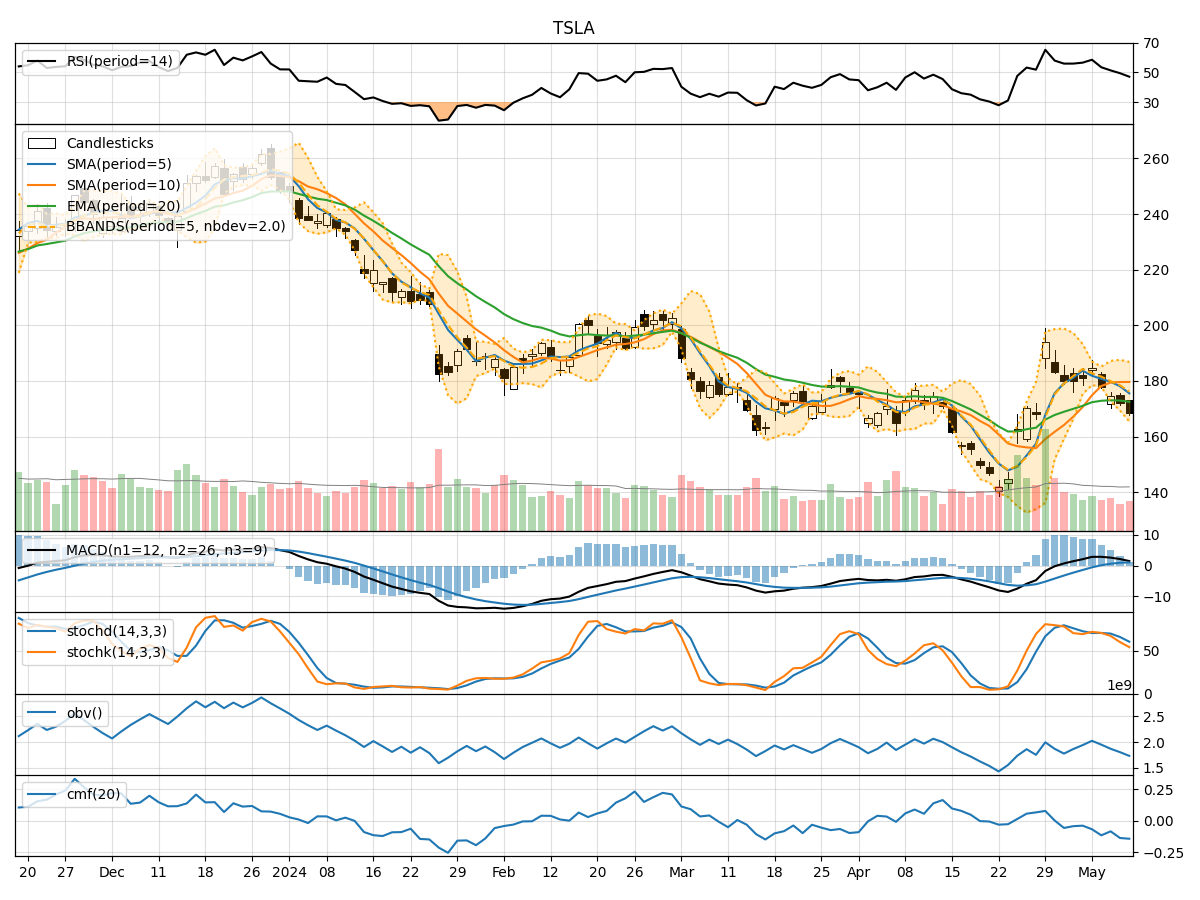
- Moving Averages (MA): The 5-day Moving Average (MA) has been consistently decreasing, indicating a downward trend in the stock price.
- MACD: The MACD line has been declining, with the MACD histogram also showing a decrease in momentum.
- EMA: The Exponential Moving Average (EMA) has been trending downwards, reflecting a bearish sentiment in the market.
Key Observation: The trend indicators suggest a bearish outlook for TSLA in the short term.
Momentum Analysis:
- RSI: The Relative Strength Index (RSI) has been decreasing, indicating weakening momentum.
- Stochastic Oscillator: Both %K and %D have been declining, signaling a loss in buying pressure.
- Williams %R: The Williams %R is in oversold territory, suggesting a potential reversal.
Key Observation: Momentum indicators point towards a bearish momentum in the stock.
Volatility Analysis:
- Bollinger Bands: The Bollinger Bands are widening, indicating increased volatility in the stock price.
- Bollinger %B: The %B is below 1, suggesting the stock is trading below the lower Bollinger Band.
Key Observation: Volatility indicators show heightened volatility and potential oversold conditions.
Volume Analysis:
- On-Balance Volume (OBV): The OBV has been declining, indicating selling pressure in the stock.
- Chaikin Money Flow (CMF): The CMF is negative, suggesting outflow of money from the stock.
Key Observation: Volume indicators reflect a bearish sentiment with increasing selling pressure.
Conclusion:
Based on the analysis of trend, momentum, volatility, and volume indicators, the overall outlook for TSLA in the next few days is bearish. The stock is likely to experience further downward movement, driven by the prevailing negative trend, weakening momentum, increased volatility, and high selling volume. Traders and investors should exercise caution and consider short-term strategies to capitalize on potential downside opportunities.
Key Conclusion: The next few days are likely to see TSLA continuing its downward trajectory, with a potential for further price decline.