Technical Analysis of TSAT 2024-05-10
Overview:
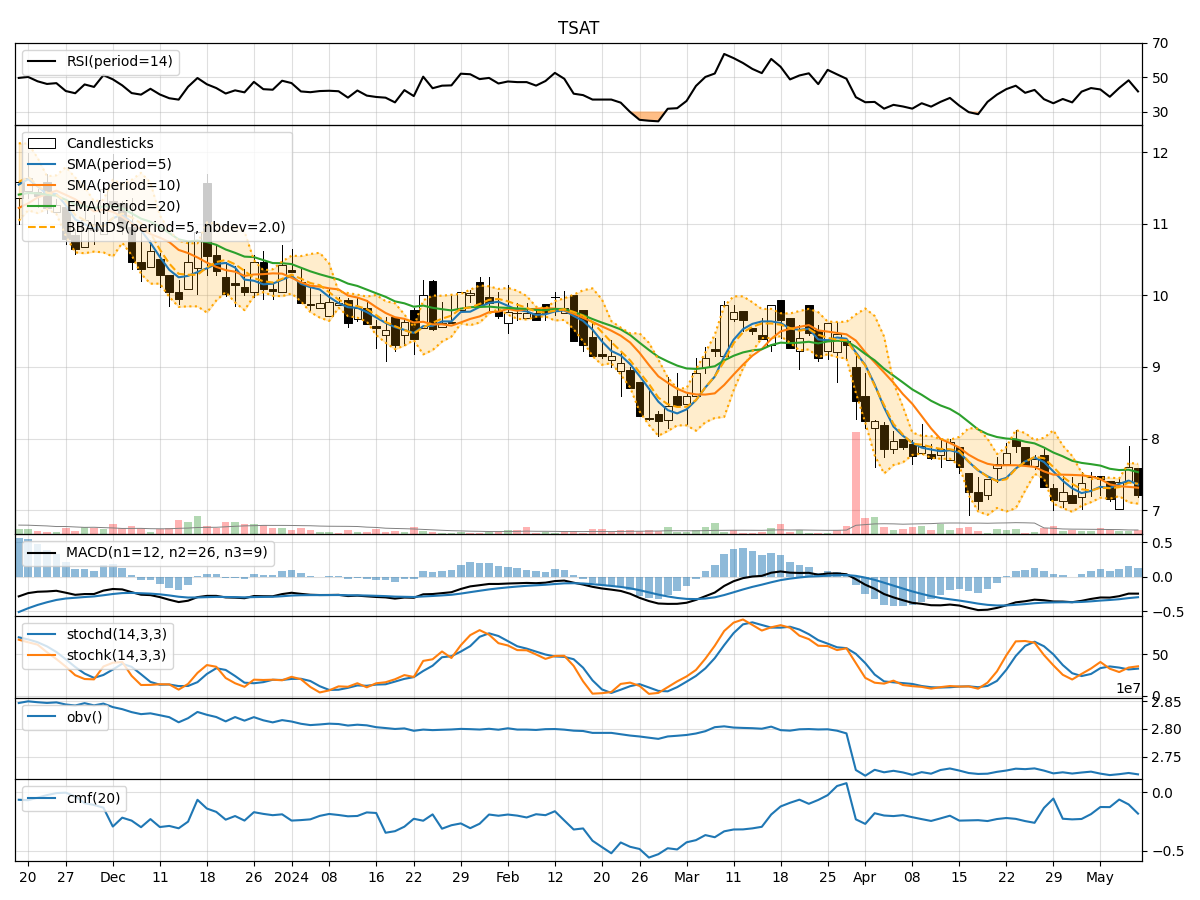
In the last 5 trading days, TSAT stock has shown mixed signals across various technical indicators. The stock's price has fluctuated within a certain range, indicating indecision in the market. By analyzing trend, momentum, volatility, and volume indicators, we can gain insights into the potential future price movement of TSAT stock.
Trend Analysis:
- Moving Averages (MA): The 5-day MA has been fluctuating around the closing price, indicating short-term price volatility. The Simple Moving Average (SMA) and Exponential Moving Average (EMA) show a downward trend, suggesting a bearish sentiment in the short to mid-term.
- Moving Average Convergence Divergence (MACD): The MACD line has been consistently below the signal line, indicating a bearish trend. The MACD histogram has shown a slight increase but remains in negative territory, signaling potential weakness in the stock price.
Momentum Analysis:
- Relative Strength Index (RSI): The RSI values have been fluctuating around the 50 level, indicating a lack of strong momentum in either direction. This suggests a neutral stance in terms of momentum.
- Stochastic Oscillator: Both %K and %D lines of the Stochastic Oscillator have been moving within a tight range, reflecting a lack of clear direction in momentum.
Volatility Analysis:
- Bollinger Bands (BB): The Bollinger Bands have shown narrowing bands, indicating decreasing volatility. The stock price has been trading within the bands, suggesting a period of consolidation.
- Bollinger Band Percentage (BBP): The BBP values have been relatively low, indicating that the stock is trading closer to the lower band, which could signal a potential oversold condition.
Volume Analysis:
- On-Balance Volume (OBV): The OBV values have been fluctuating, indicating mixed buying and selling pressure. The declining OBV suggests a slight increase in selling volume.
- Chaikin Money Flow (CMF): The CMF values have been negative, indicating that money is flowing out of the stock. This suggests a bearish sentiment in terms of volume flow.
Conclusion:
Based on the analysis of the technical indicators, the next few days for TSAT stock are likely to see sideways movement with a slight bearish bias. The trend indicators suggest a bearish sentiment, while the momentum indicators show a lack of clear direction. The volatility indicators point towards a period of consolidation, and the volume indicators indicate mixed buying and selling pressure.
Key Conclusion: The overall outlook for TSAT stock in the next few days leans towards sideways movement with a slight bearish bias. Investors should closely monitor key support and resistance levels for potential entry or exit points.