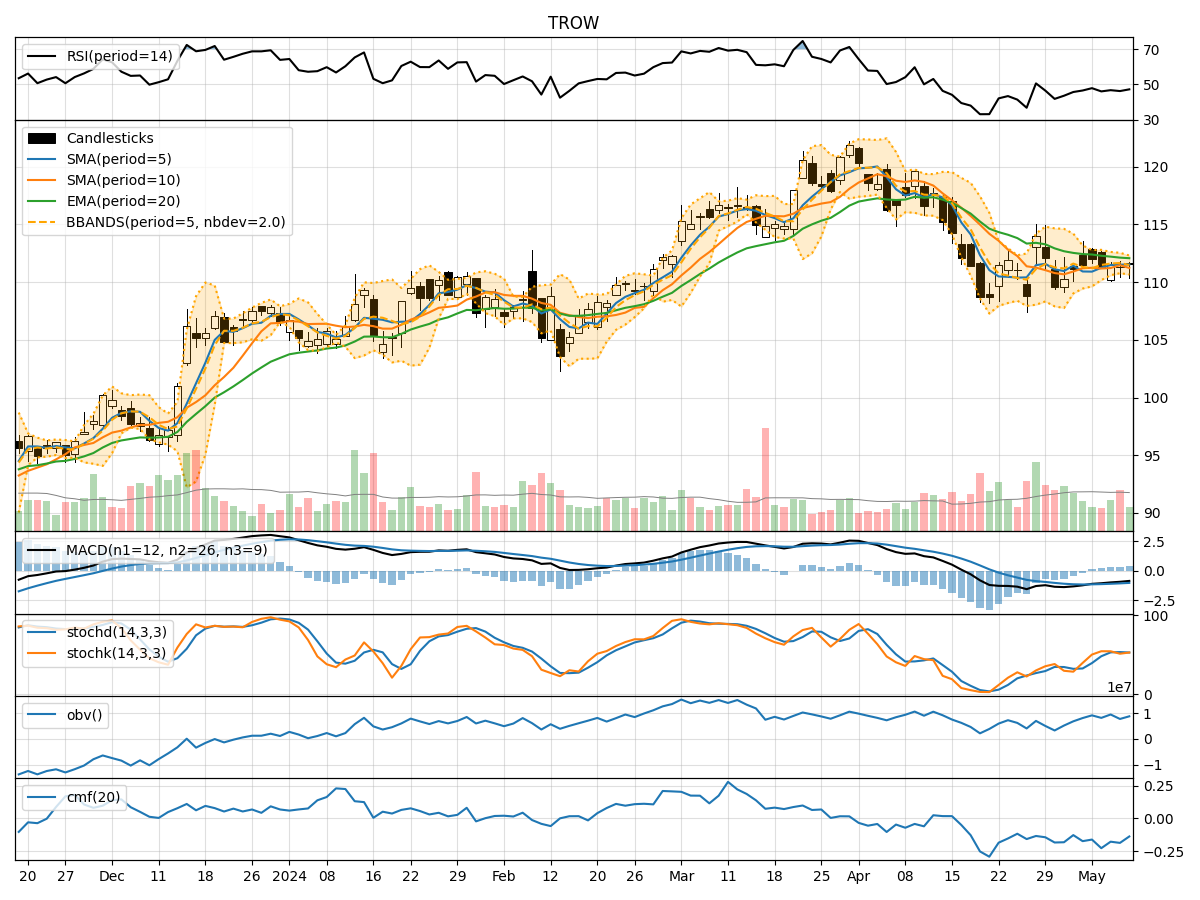
Technical Analysis of TROW 2024-05-10
Overview:
In the last 5 trading days, TROW has shown relatively stable price movements with minor fluctuations. The technical indicators provide insights into the trend, momentum, volatility, and volume of the stock. By analyzing these indicators, we can make informed predictions about the possible future stock price movements of TROW.
Trend Analysis:
- Moving Averages (MA): The 5-day Moving Average (MA) has been hovering around the closing prices, indicating a short-term trend. The Simple Moving Average (SMA) and Exponential Moving Average (EMA) suggest a slightly bearish sentiment as they are below the current price levels.
- MACD: The Moving Average Convergence Divergence (MACD) has been positive but decreasing, indicating a potential reversal in the short-term trend.
- MACD Histogram: The MACD Histogram has been rising, suggesting increasing bullish momentum.
Momentum Analysis:
- RSI: The Relative Strength Index (RSI) has been in the neutral zone, indicating neither overbought nor oversold conditions.
- Stochastic Oscillator: Both %K and %D lines of the Stochastic Oscillator have been fluctuating around the mid-level, suggesting indecision in momentum.
- Williams %R: The Williams %R is also in the neutral zone, not providing a clear direction for momentum.
Volatility Analysis:
- Bollinger Bands: The Bollinger Bands have been narrowing, indicating decreasing volatility and a potential upcoming price breakout.
- Bollinger %B: The %B indicator is close to 0.5, suggesting the stock is trading near the middle of the bands.
Volume Analysis:
- On-Balance Volume (OBV): The OBV has been fluctuating, indicating mixed buying and selling pressure.
- Chaikin Money Flow (CMF): The CMF has been negative, suggesting a lack of strong buying interest in the stock.
Conclusion:
Based on the analysis of the technical indicators: - Trend: The trend indicators show a slightly bearish sentiment in the short term. - Momentum: Momentum indicators are neutral, indicating a lack of clear direction in momentum. - Volatility: Volatility is decreasing, potentially leading to a breakout in price. - Volume: Volume indicators suggest mixed trading activity with a lack of strong buying interest.
Overall Assessment:
- Direction: The stock is currently in a sideways consolidation phase with a slight bearish bias in the short term.
- Potential Price Movement: Given the mixed signals from the indicators, the stock is likely to continue trading within a narrow range in the next few days.
- Recommendation: It is advisable to closely monitor the price action for any breakout above or below the current range to determine the next significant price movement.
Key Takeaway:
- Stay Cautious: With the lack of clear direction in key indicators, it is essential to exercise caution and wait for a decisive move before taking any significant trading positions.
- Monitor Breakout Levels: Keep a close eye on the upper and lower Bollinger Bands for potential breakout signals that could indicate a shift in the current consolidation phase.
Disclaimer:
This analysis is based on technical indicators and historical data, and market conditions can change rapidly. It is crucial to consider other factors and conduct thorough research before making any investment decisions.