Technical Analysis of TRNR 2024-05-31
Overview:
In analyzing the technical indicators for TRNR over the last 5 days, we will delve into the trend, momentum, volatility, and volume indicators to provide a comprehensive outlook on the possible stock price movement. By examining these key aspects, we aim to offer valuable insights and predictions for the upcoming days.
Trend Analysis:
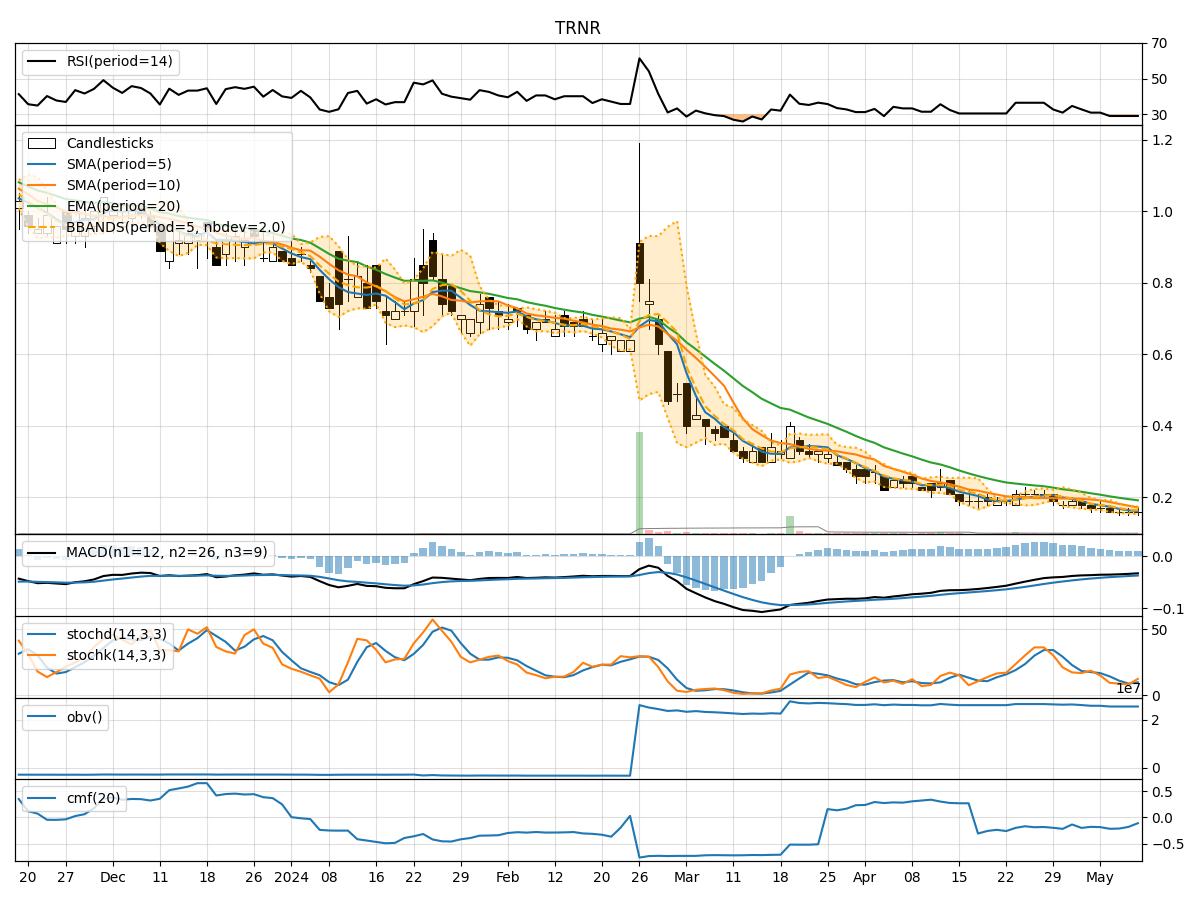
- Moving Averages (MA): The 5-day Moving Average (MA) has shown fluctuations, indicating a lack of clear trend direction.
- MACD: The Moving Average Convergence Divergence (MACD) has been negative, suggesting a bearish momentum.
- EMA: The Exponential Moving Average (EMA) has been relatively stable but below the current price, indicating a potential resistance level.
Key Observation: The trend indicators suggest a lack of strong bullish momentum and a presence of bearish signals.
Momentum Analysis:
- RSI: The Relative Strength Index (RSI) has been fluctuating around the neutral zone, indicating indecision in the market.
- Stochastic Oscillator: The Stochastic indicators have shown mixed signals, with some days indicating oversold conditions.
Key Observation: The momentum indicators reflect a lack of strong buying or selling pressure, signaling a potential consolidation phase.
Volatility Analysis:
- Bollinger Bands (BB): The Bollinger Bands have shown narrowing bands, indicating decreasing volatility.
- BB Percentage (BBP): The BB Percentage has been decreasing, suggesting a reduction in price volatility.
Key Observation: Volatility indicators point towards a potential decrease in price fluctuations and a period of stability.
Volume Analysis:
- On-Balance Volume (OBV): The OBV has shown mixed movements, indicating uncertainty in the volume flow.
- Chaikin Money Flow (CMF): The CMF has been fluctuating around the zero line, signaling a balance between buying and selling pressure.
Key Observation: Volume indicators suggest a lack of clear accumulation or distribution patterns, reflecting market indecision.
Conclusion:
Based on the analysis of the technical indicators, the stock price of TRNR is likely to experience sideways movement in the next few days. The lack of strong trend signals, mixed momentum indicators, decreasing volatility, and uncertain volume patterns indicate a period of consolidation and indecision in the market. Traders and investors should exercise caution and wait for clearer signals before making significant trading decisions.
Key Conclusion:
The overall outlook for TRNR is neutral with a sideways bias in the short term.