Technical Analysis of TOP 2024-05-10
Overview:
In analyzing the technical indicators for the stock over the last 5 days, we will delve into the trend, momentum, volatility, and volume indicators to provide a comprehensive assessment of the possible future stock price movement. By examining these key aspects, we aim to offer valuable insights and predictions for the upcoming trading days.
Trend Indicators:
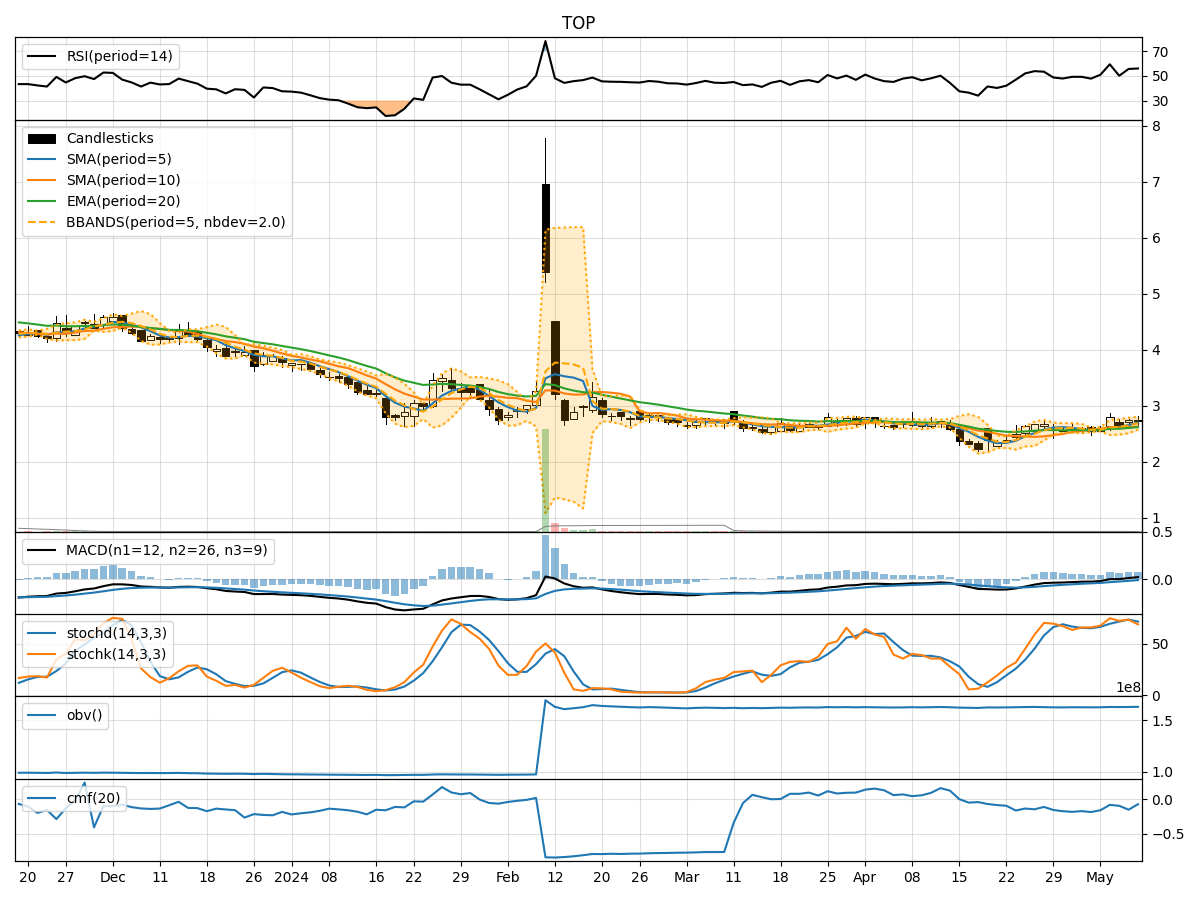
- Moving Averages (MA): The 5-day Moving Average (MA) has been showing an upward trend, indicating a positive momentum in the stock price.
- MACD (Moving Average Convergence Divergence): The MACD line has been consistently above the signal line, suggesting a bullish trend in the stock.
- EMA (Exponential Moving Average): The EMA has been trending upwards, further supporting the bullish sentiment in the stock.
Momentum Indicators:
- RSI (Relative Strength Index): The RSI has been hovering around the mid-level, indicating a neutral momentum in the stock.
- Stochastic Oscillator: Both %K and %D have been fluctuating but staying within the overbought territory, suggesting a potential reversal or consolidation phase.
- Williams %R (Willams Percentage Range): The Williams %R has been showing oversold conditions, hinting at a possible bullish reversal.
Volatility Indicators:
- Bollinger Bands: The Bollinger Bands have been widening, indicating increased volatility in the stock price.
- Bollinger %B: The %B indicator has been fluctuating within the bands, suggesting potential price reversals or breakouts.
Volume Indicators:
- On-Balance Volume (OBV): The OBV has been relatively stable, indicating a balance between buying and selling pressure.
- Chaikin Money Flow (CMF): The CMF has been negative, signaling a bearish sentiment in the stock.
Key Observations:
- The trend indicators suggest a bullish outlook with moving averages and MACD supporting an upward trajectory.
- Momentum indicators show mixed signals with RSI neutral, Stochastic indicating potential reversal, and Williams %R hinting at a bullish reversal.
- Volatility indicators point towards increased price fluctuations, potentially leading to significant price movements.
- Volume indicators reflect a balanced market sentiment with OBV stability and CMF indicating bearish pressure.
Conclusion:
Based on the analysis of the technical indicators, the stock is likely to experience upward momentum in the next few trading days. The bullish trend supported by moving averages and MACD, coupled with potential bullish reversals indicated by momentum indicators, suggests a positive outlook for the stock price. However, increased volatility may lead to sharp price movements, requiring careful monitoring of key support and resistance levels. Traders and investors should consider entering long positions with proper risk management strategies in place to capitalize on the expected upward movement in the stock price.