Technical Analysis of TLRY 2024-05-03
TLRY Stock Technical Analysis Overview:
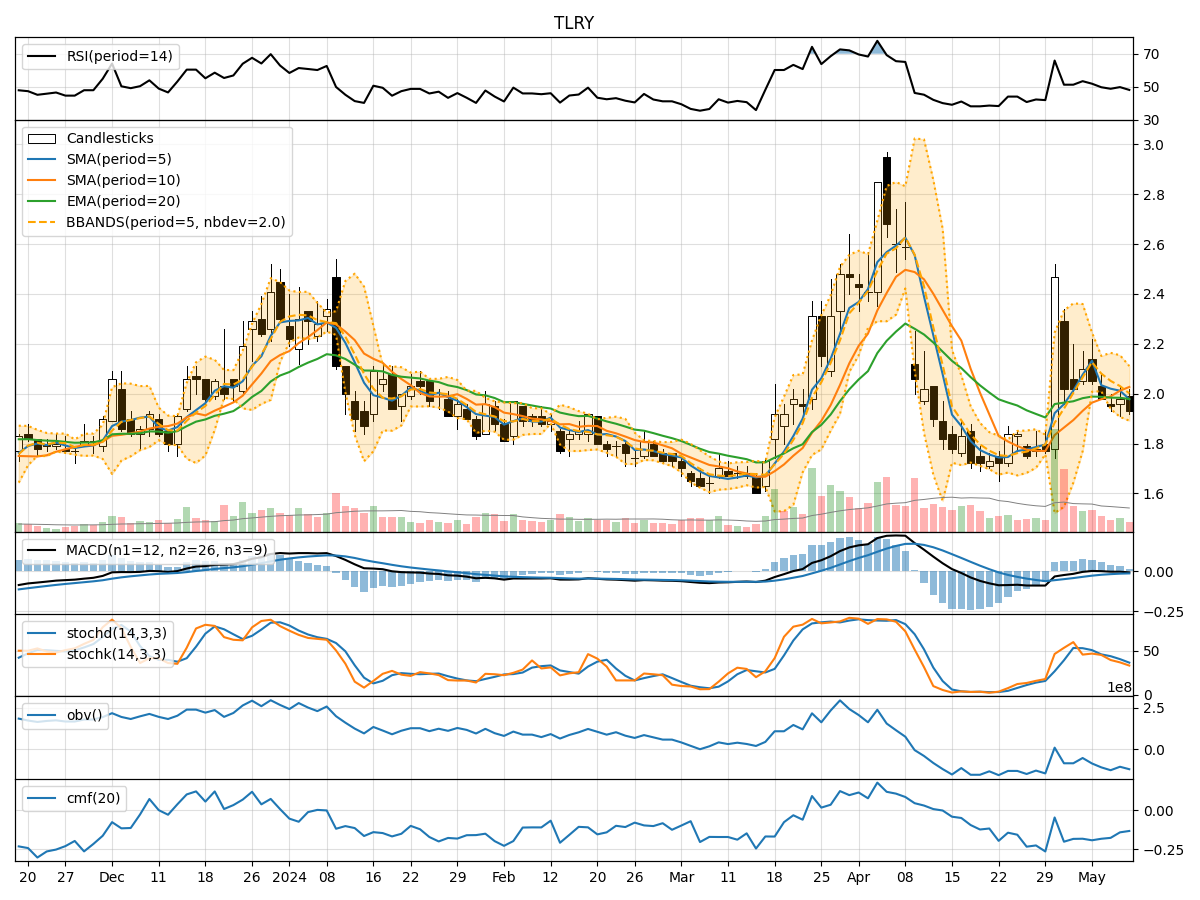
In the last 5 trading days, TLRY stock has shown mixed signals across various technical indicators. The stock price has fluctuated within a range, experiencing both positive and negative movements. By analyzing trend, momentum, volatility, and volume indicators, we can gain insights into the potential future price movement of TLRY stock.
Trend Analysis:
-
Moving Averages (MA): The 5-day Moving Average (MA) has been fluctuating around the closing prices, indicating short-term price trends. The Simple Moving Average (SMA) and Exponential Moving Average (EMA) have shown slight convergence but remain below the closing prices.
-
MACD: The Moving Average Convergence Divergence (MACD) has been negative, indicating a bearish trend. However, the MACD Histogram has shown signs of improvement, moving towards the zero line.
Momentum Analysis:
-
RSI: The Relative Strength Index (RSI) has been fluctuating around the mid-level, indicating a neutral momentum in the stock.
-
Stochastic Oscillator: The Stochastic Oscillator has shown mixed signals, with the %K line crossing the %D line multiple times, suggesting indecision in the market.
Volatility Analysis:
- Bollinger Bands: The Bollinger Bands have widened, indicating increased volatility in the stock price. The stock has touched the upper band, suggesting potential overbought conditions.
Volume Analysis:
-
On-Balance Volume (OBV): The OBV has shown a negative trend, indicating selling pressure in the stock. This aligns with the price movements observed in the last few days.
-
Chaikin Money Flow (CMF): The CMF has been negative, indicating a lack of buying interest in the stock.
Key Observations and Opinions:
-
Trend: The trend indicators suggest a neutral to slightly bearish outlook in the short term.
-
Momentum: The momentum indicators show a lack of clear direction, indicating indecision among traders.
-
Volatility: Increased volatility suggests potential price swings in the coming days.
-
Volume: The negative OBV and CMF indicate a bearish sentiment among investors.
Conclusion:
Based on the analysis of the technical indicators, the next few days for TLRY stock are likely to see sideways movement with a bearish bias. The stock may continue to trade within a range, with potential price swings due to increased volatility. Traders should exercise caution and closely monitor key support and resistance levels for potential entry or exit points.