Technical Analysis of TIGO 2024-05-10
Overview:
In analyzing the technical indicators for TIGO over the last 5 days, we will delve into the trend, momentum, volatility, and volume indicators to provide a comprehensive outlook on the possible stock price movement. By examining these key aspects, we aim to offer valuable insights and predictions for the upcoming days.
Trend Indicators:
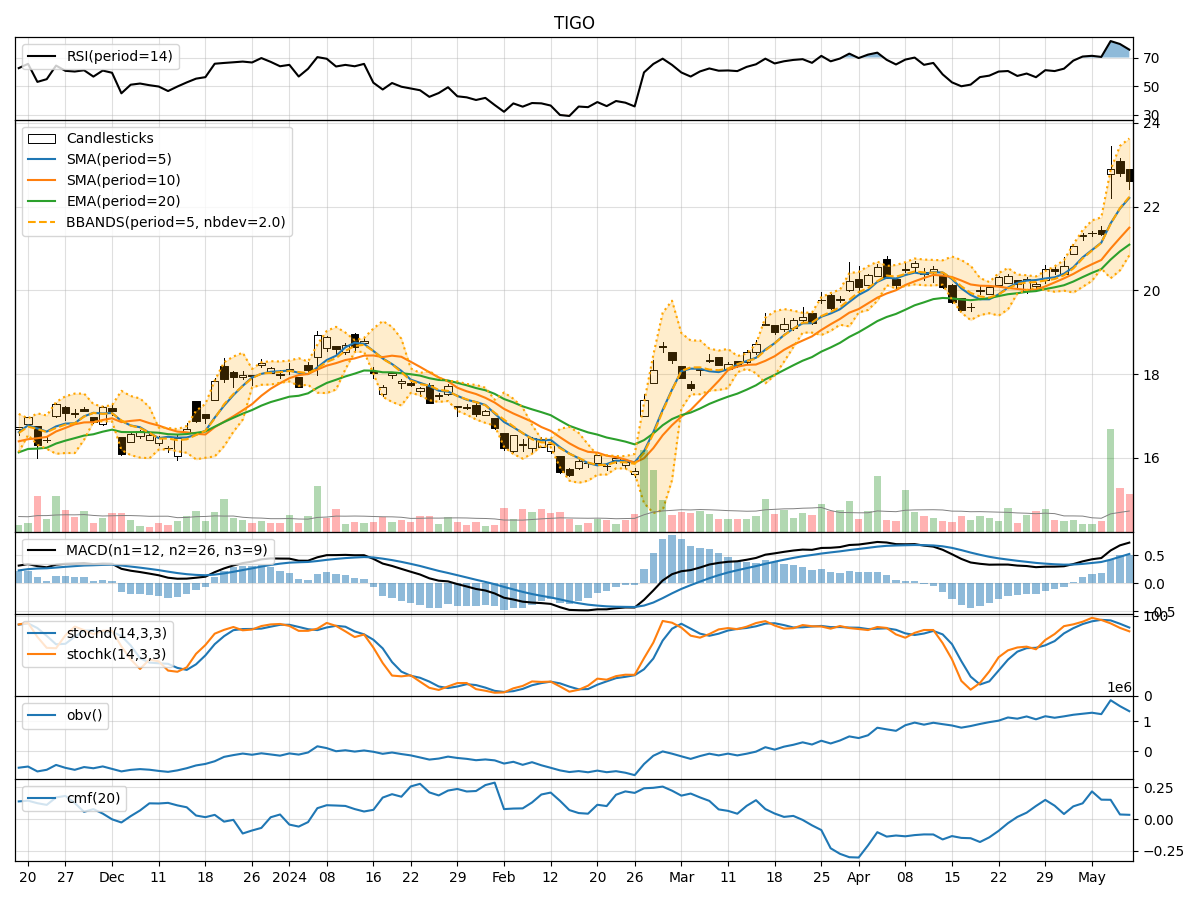
- Moving Averages (MA): The 5-day MA has been consistently rising, indicating a bullish trend in the short term.
- MACD: The MACD line has been above the signal line, suggesting positive momentum.
- EMA: The EMA has been trending upwards, supporting the bullish sentiment.
Key Observation: The trend indicators point towards a bullish outlook for TIGO in the short term.
Momentum Indicators:
- RSI: The RSI has been fluctuating but generally staying in the overbought territory, indicating strong buying momentum.
- Stochastic Oscillator: Both %K and %D have been declining but remain in the overbought zone.
- Williams %R: The indicator has been in the oversold region, suggesting a potential reversal.
Key Observation: Momentum indicators signal a mixed sentiment with a slight bias towards a potential pullback.
Volatility Indicators:
- Bollinger Bands: The stock price has been trading within the bands, indicating normal volatility.
- Bollinger %B: The %B indicator has been fluctuating around the midline, suggesting balanced volatility.
Key Observation: Volatility indicators imply a stable price movement with no extreme fluctuations.
Volume Indicators:
- On-Balance Volume (OBV): The OBV has been fluctuating, indicating mixed buying and selling pressure.
- Chaikin Money Flow (CMF): The CMF has been positive but decreasing, signaling a potential decrease in buying pressure.
Key Observation: Volume indicators suggest a neutral stance with no clear dominance of buying or selling pressure.
Conclusion:
Based on the analysis of the technical indicators, the bullish trend indicated by moving averages and MACD, coupled with the strong buying momentum highlighted by RSI and stochastic oscillator, suggests a potential for upward movement in the stock price in the coming days. However, the mixed signals from momentum and volume indicators caution towards a possible consolidation or pullback before resuming the upward trend.
Recommendation:
Considering the overall technical outlook, it is advisable to monitor the stock closely for any signs of reversal or continuation of the bullish trend. Traders may consider buying on dips within a well-defined risk management strategy to capitalize on potential price movements. Additionally, keeping an eye on key support and resistance levels can help in making informed trading decisions.
In conclusion, while the technical indicators suggest a bullish bias, it is essential to remain vigilant and adapt to changing market conditions to navigate potential price fluctuations effectively.