Technical Analysis of TETE 2024-05-10
Overview:
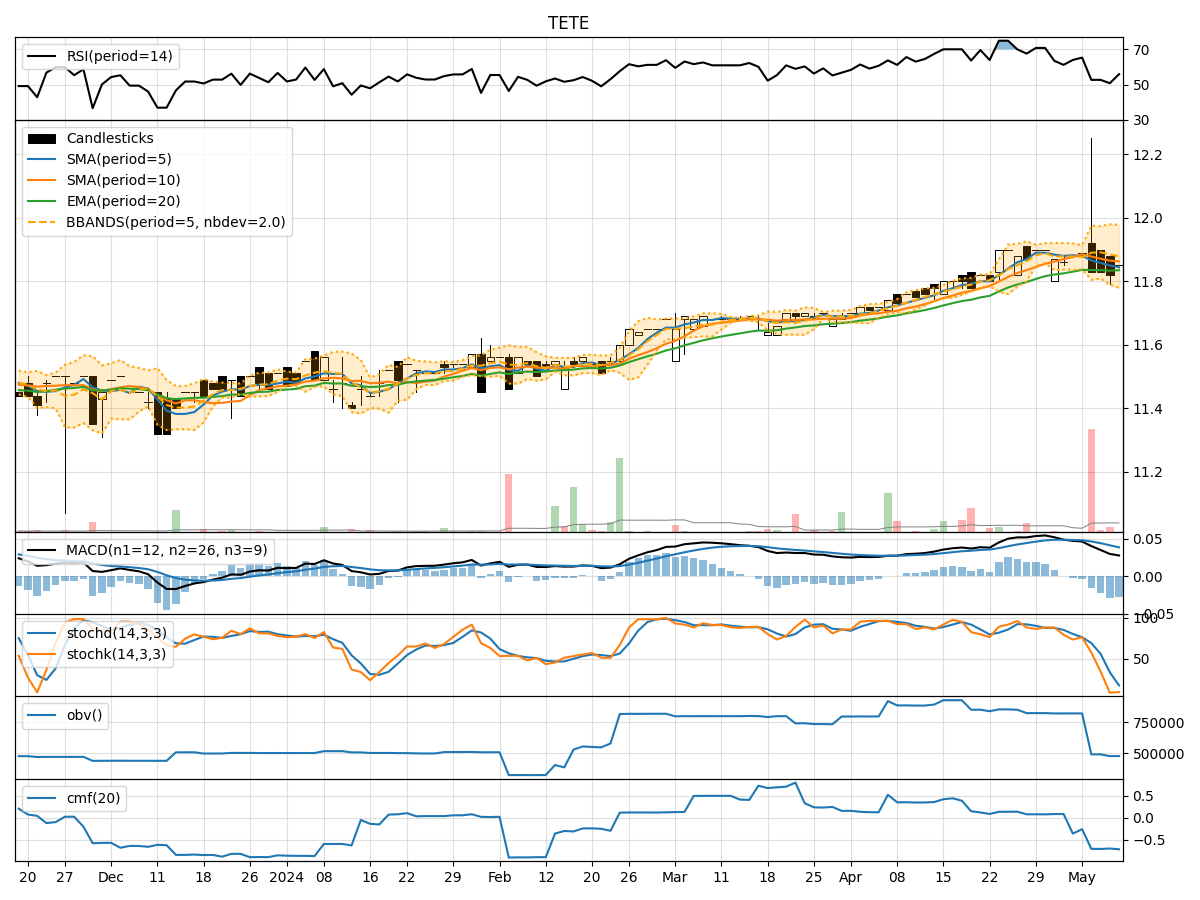
In analyzing the technical indicators for TETE stock over the last 5 days, we will delve into the trends, momentum, volatility, and volume aspects to provide a comprehensive outlook on the possible stock price movement in the coming days. By examining key indicators such as moving averages, MACD, RSI, Stochastic Oscillator, Bollinger Bands, OBV, and Chaikin Money Flow, we aim to offer valuable insights and predictions for informed decision-making.
Trend Analysis:
- Moving Averages (MA): The 5-day MA has been relatively stable around the closing prices, indicating a short-term trend. However, it is slightly declining, suggesting a potential weakening in momentum.
- MACD: The MACD line has been positive but decreasing, while the MACD Histogram has been consistently negative, signaling a bearish momentum.
Momentum Analysis:
- RSI: The RSI values have been fluctuating around the mid-level, indicating indecision in the market sentiment.
- Stochastic Oscillator: Both %K and %D values have been low, suggesting a potential oversold condition in the stock.
Volatility Analysis:
- Bollinger Bands: The stock price has been trading within the Bollinger Bands, with the bands narrowing, indicating reduced volatility and a possible upcoming breakout.
Volume Analysis:
- On-Balance Volume (OBV): The OBV has been relatively stable, indicating a balance between buying and selling pressure.
- Chaikin Money Flow (CMF): The CMF has been negative, reflecting a bearish money flow in the stock.
Key Observations:
- The stock is currently in a consolidation phase with a slight bearish bias, as indicated by the declining moving averages and negative MACD Histogram.
- The RSI and Stochastic Oscillator suggest a neutral to oversold condition, reflecting a lack of strong buying interest.
- The narrowing Bollinger Bands indicate a potential breakout in the stock price, with volatility likely to increase in the near future.
- The OBV and CMF show a lack of significant accumulation or distribution, pointing towards a balanced market sentiment.
Conclusion:
Based on the technical analysis of TETE stock, the outlook for the next few days is likely to be sideways with a bearish bias. Traders should exercise caution and wait for a clear breakout above the Bollinger Bands or a reversal in the momentum indicators before considering any significant positions. It is advisable to closely monitor the price action and key support/resistance levels for potential trading opportunities.