Technical Analysis of TECH 2024-05-10
Overview:
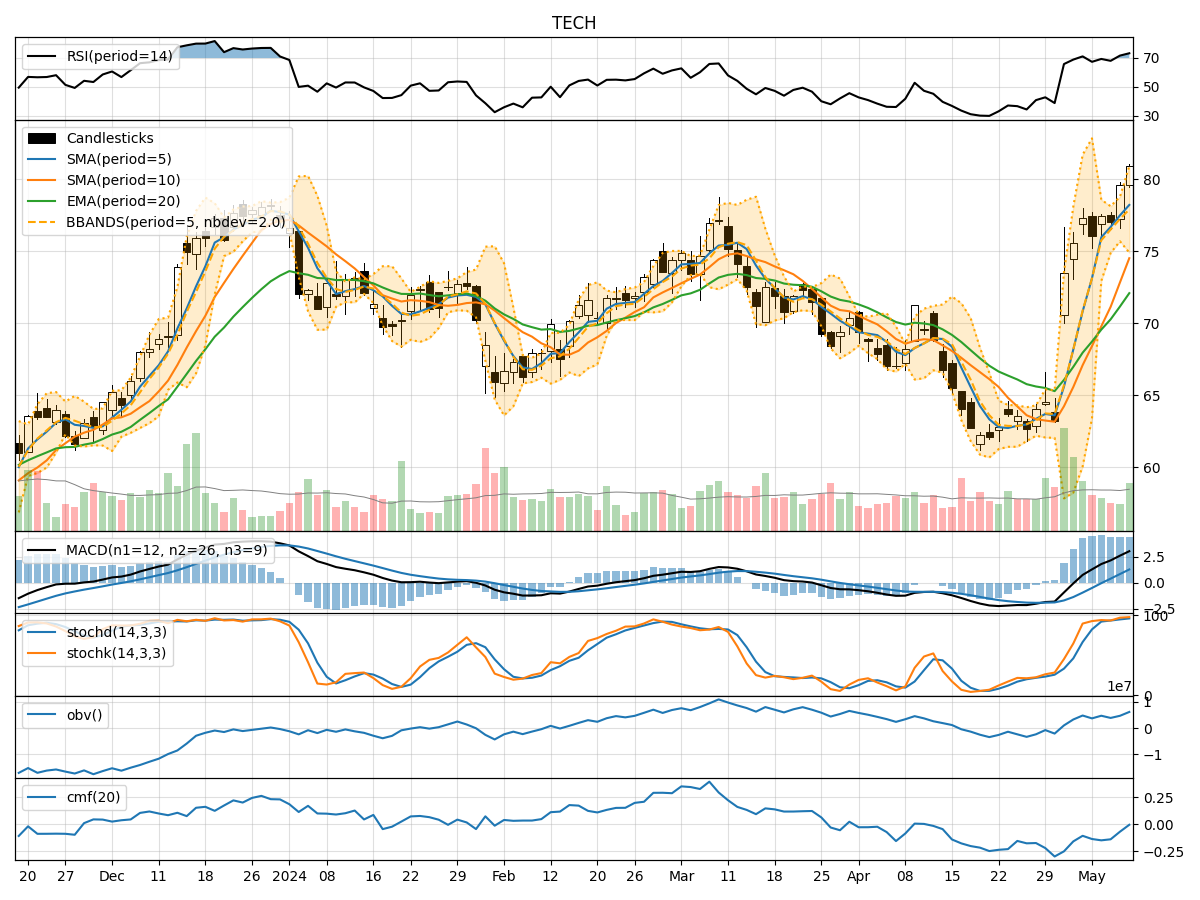
In the last 5 trading days, the stock price of TECH has shown a consistent uptrend, supported by increasing volume and positive momentum indicators. The moving averages have been trending upwards, and the MACD and RSI have been indicating bullish momentum. However, the stock has entered overbought territory based on the stochastic indicators. The Bollinger Bands are expanding, suggesting increased volatility.
Trend Indicators Analysis:
- Moving Averages (MA): The 5-day MA has been consistently above the longer-term SMAs, indicating a strong uptrend.
- MACD: The MACD line has been above the signal line, indicating bullish momentum.
- MACD Histogram: The histogram has been increasing, showing strengthening bullish momentum.
Key Observation: The trend indicators suggest a strong bullish trend in the stock price.
Momentum Indicators Analysis:
- RSI: The RSI has been in the overbought zone, indicating a potential reversal or consolidation.
- Stochastic Oscillator: Both %K and %D have been in the overbought region, signaling a possible pullback.
- Williams %R: The indicator is also in the oversold territory, suggesting a potential reversal.
Key Observation: Momentum indicators are signaling a potential reversal or consolidation due to overbought conditions.
Volatility Indicators Analysis:
- Bollinger Bands (BB): The bands have been expanding, indicating increased volatility in the stock price.
Key Observation: Volatility is on the rise, which could lead to larger price swings in the near future.
Volume Indicators Analysis:
- On-Balance Volume (OBV): The OBV has been increasing, showing accumulation by investors.
- Chaikin Money Flow (CMF): The CMF has been negative, indicating selling pressure.
Key Observation: While OBV suggests buying interest, CMF reflects selling pressure in the stock.
Conclusion:
Based on the technical indicators and analysis: - Trend: The stock is in a strong uptrend supported by moving averages and MACD. - Momentum: Momentum indicators suggest a potential reversal or consolidation due to overbought conditions. - Volatility: Volatility is increasing, which could lead to larger price swings. - Volume: While OBV shows accumulation, CMF indicates selling pressure.
Forecast:
Considering the overbought conditions in momentum indicators and the increasing volatility, the stock price of TECH is likely to experience a short-term pullback or consolidation in the next few days. Traders should be cautious and consider taking profits or implementing risk management strategies. Long-term investors may use any pullback as a buying opportunity to capitalize on the overall bullish trend.