Technical Analysis of TCTM 2024-05-10
Overview:
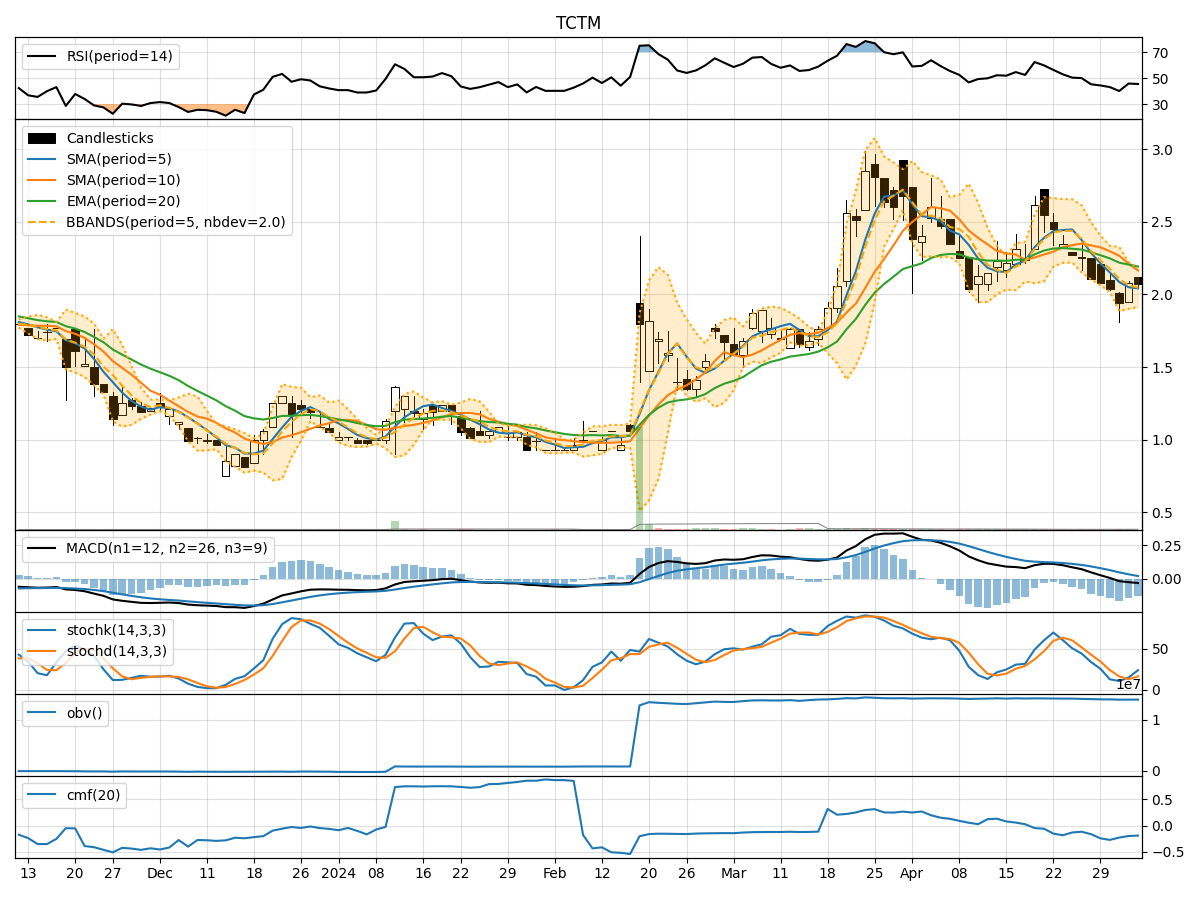
In analyzing the technical indicators for TCTM stock over the last 5 days, we will delve into the trends, momentum, volatility, and volume aspects to provide a comprehensive outlook on the possible stock price movement in the coming days. By examining key indicators such as moving averages, MACD, RSI, Bollinger Bands, and OBV, we aim to offer valuable insights and predictions for potential price action.
Trend Analysis:
- Moving Averages (MA): The 5-day MA has been declining, indicating a short-term bearish trend.
- MACD: The MACD line has been consistently below the signal line, suggesting bearish momentum.
- EMA: The EMA has been decreasing, aligning with the bearish sentiment in the short term.
Momentum Analysis:
- RSI: The RSI has been hovering around 45-42, indicating a neutral to slightly bearish momentum.
- Stochastic Oscillator: Both %K and %D have been fluctuating in the oversold territory, signaling a potential reversal.
- Williams %R: The indicator has been in the oversold region, suggesting a bearish sentiment.
Volatility Analysis:
- Bollinger Bands: The stock price has been trading below the lower Bollinger Band, indicating oversold conditions.
- Bollinger %B: The %B indicator is near 0, suggesting a potential bounce back in price.
- Bollinger Band Width: The band width has widened, indicating increased volatility.
Volume Analysis:
- On-Balance Volume (OBV): The OBV has been relatively flat, indicating a lack of strong buying or selling pressure.
- Chaikin Money Flow (CMF): The CMF has been negative, reflecting a bearish money flow trend.
Key Observations:
- The stock is currently in a bearish trend based on moving averages and MACD.
- Momentum indicators suggest a neutral to slightly bearish sentiment.
- Volatility has increased, indicating potential price swings.
- Volume indicators show a lack of significant buying or selling pressure.
Conclusion:
Based on the analysis of technical indicators, the stock is likely to continue its downward movement in the short term. The bearish trend indicated by moving averages and MACD, coupled with oversold conditions in momentum indicators, suggests a potential further decline in price. However, increased volatility could lead to short-term price bounces or reversals. Traders should exercise caution and consider waiting for confirmation of a trend reversal before considering long positions.