Technical Analysis of TCJH 2024-05-10
Overview:
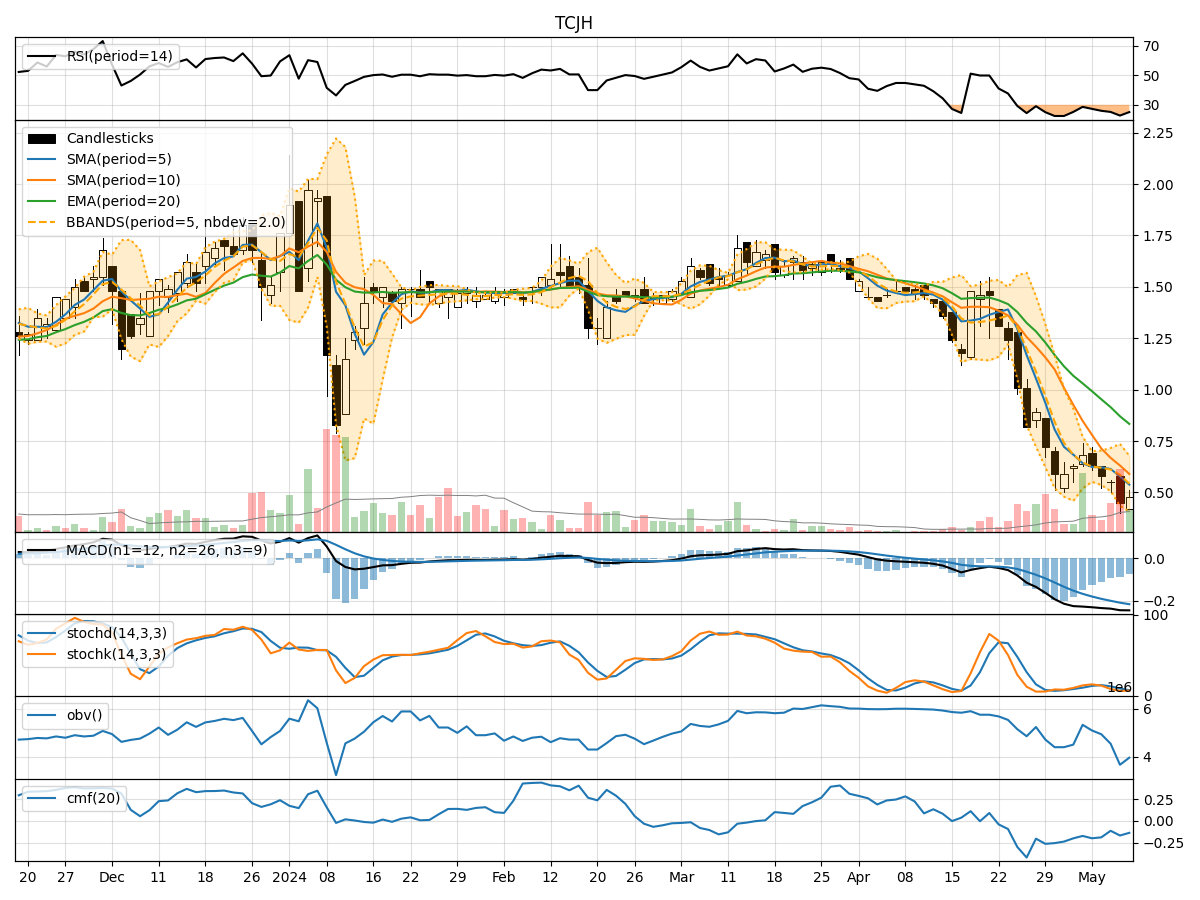
In analyzing the technical indicators for TCJH stock over the last 5 days, we will delve into the trends, momentum, volatility, and volume aspects to provide a comprehensive outlook on the possible future stock price movement. By examining key indicators such as moving averages, MACD, RSI, Bollinger Bands, and OBV, we aim to offer valuable insights and predictions for potential price action.
Trend Analysis:
- Moving Averages (MA): The 5-day MA has been consistently declining, indicating a bearish trend.
- MACD: The MACD line has been below the signal line, suggesting a bearish momentum.
- EMA: The EMA has been decreasing, reinforcing the bearish sentiment in the short term.
Momentum Analysis:
- RSI: The RSI has been trending downwards, reflecting weakening momentum.
- Stochastic Oscillator: Both %K and %D have been decreasing, signaling a bearish momentum.
- Williams %R: The indicator has been in oversold territory, indicating a potential reversal.
Volatility Analysis:
- Bollinger Bands: The stock price has been consistently below the lower Bollinger Band, indicating oversold conditions.
- Bollinger Band Width: The band width has been narrowing, suggesting a potential decrease in volatility.
Volume Analysis:
- On-Balance Volume (OBV): The OBV has been declining, indicating selling pressure.
- Chaikin Money Flow (CMF): The CMF has been negative, signaling outflows from the stock.
Key Observations:
- The stock is currently in a strong bearish trend based on moving averages and MACD.
- Momentum indicators like RSI and Stochastic Oscillator support the bearish sentiment with oversold conditions.
- Volatility is decreasing as per Bollinger Bands, indicating a potential stabilization in price movement.
- Volume indicators suggest increased selling pressure and negative money flow.
Conclusion:
Based on the analysis of technical indicators, the next few days for TCJH stock are likely to see further downside movement. The bearish trend is well-established, supported by momentum indicators and volume analysis. Traders and investors should exercise caution and consider shorting or staying on the sidelines until signs of a reversal or consolidation emerge. The stock is currently in a downtrend and shows no immediate signs of a bullish reversal.