Technical Analysis of TATT 2024-05-10
Overview:
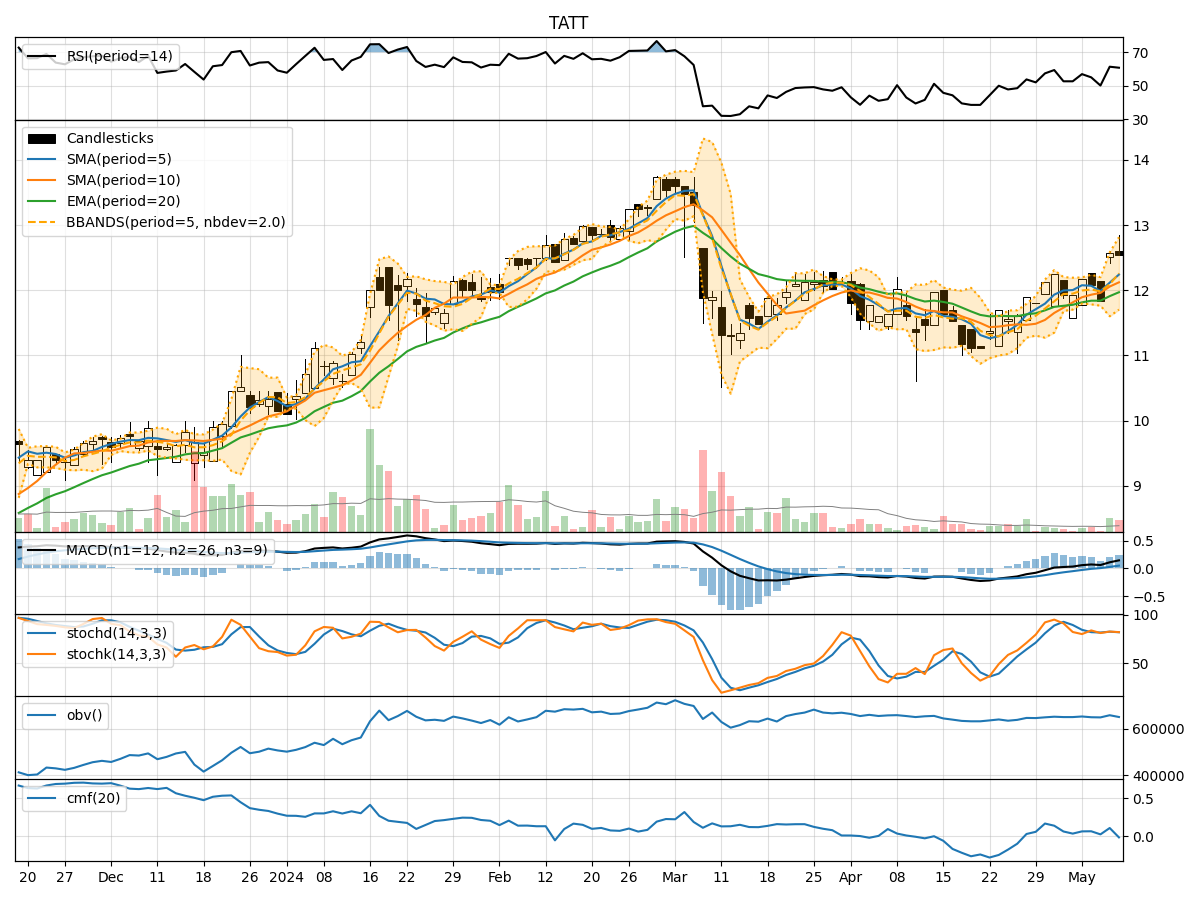
In analyzing the technical indicators for TATT over the last 5 days, we will delve into the trend, momentum, volatility, and volume indicators to provide a comprehensive outlook on the possible stock price movement in the coming days. By examining key metrics such as moving averages, MACD, RSI, Bollinger Bands, and OBV, we aim to offer valuable insights and predictions for potential price trends.
Trend Indicators Analysis:
- Moving Averages (MA): The 5-day MA has been showing an upward trend, indicating a positive momentum in the stock price.
- MACD: The MACD line has been consistently above the signal line, suggesting a bullish trend.
- EMA: The EMA has been gradually increasing, supporting the bullish sentiment in the short to medium term.
Momentum Indicators Analysis:
- RSI: The RSI has been fluctuating around the 50 level, indicating a neutral momentum in the stock.
- Stochastic Oscillator: Both %K and %D have been hovering around the overbought territory, signaling a potential reversal or consolidation.
Volatility Indicators Analysis:
- Bollinger Bands: The stock price has been trading within the bands, suggesting a period of consolidation.
- BB Width: The width of the bands has been narrowing, indicating decreasing volatility and a possible breakout in the near future.
Volume Indicators Analysis:
- On-Balance Volume (OBV): The OBV has shown mixed signals, with fluctuations in volume accumulation.
- Chaikin Money Flow (CMF): The CMF has been positive but declining, indicating a potential decrease in buying pressure.
Key Observations and Opinions:
- Trend: The stock is currently in an upward trend based on moving averages and MACD.
- Momentum: Momentum indicators suggest a neutral to slightly bearish bias due to RSI and stochastic oscillators.
- Volatility: Bollinger Bands indicate a consolidation phase, with a potential breakout on the horizon.
- Volume: Volume indicators show mixed signals, reflecting uncertainty in market participation.
Conclusion:
Based on the analysis of the technical indicators, the next few days for TATT stock may see sideways movement with a slight bearish bias. Traders should watch for a potential breakout from the consolidation phase indicated by the narrowing Bollinger Bands. It is advisable to closely monitor key support and resistance levels for potential entry or exit points.