Technical Analysis of TAOP 2024-05-10
Overview:
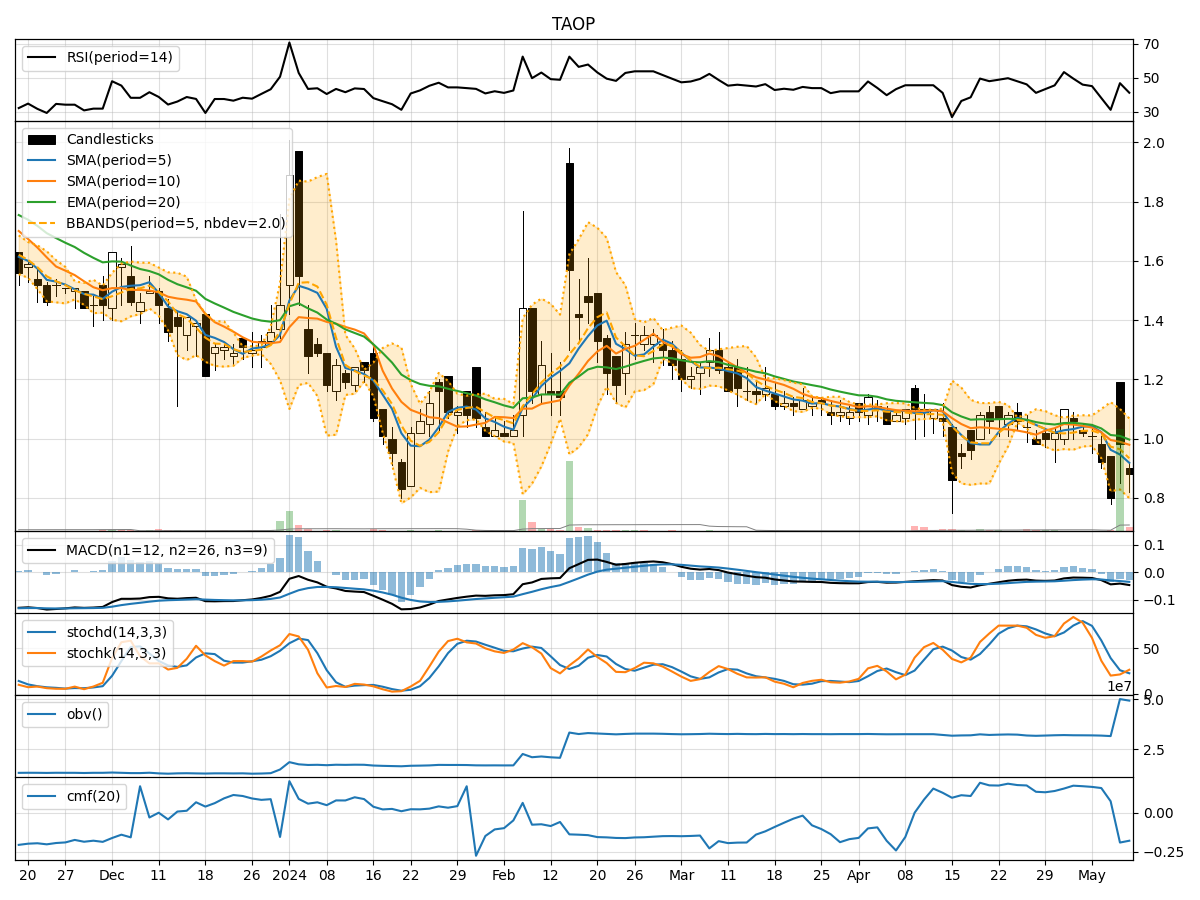
In analyzing the technical indicators for TAOP over the last 5 days, we will delve into the trend, momentum, volatility, and volume indicators to provide a comprehensive outlook on the possible stock price movement. By examining these key aspects, we aim to offer valuable insights and predictions for the upcoming days.
Trend Analysis:
- Moving Averages (MA): The 5-day MA has been consistently below the closing price, indicating a downward trend.
- MACD: The MACD line has been negative, suggesting bearish momentum in the stock.
- EMA: The EMA has been declining, further supporting the bearish trend.
Key Observation: The trend indicators point towards a downward trajectory for TAOP.
Momentum Analysis:
- RSI: The RSI has been fluctuating but remains below the overbought threshold, indicating bearish momentum.
- Stochastic Oscillator: Both %K and %D have been trending downwards, signaling weakening momentum.
- Williams %R: The indicator has been in oversold territory, reflecting bearish sentiment.
Key Observation: Momentum indicators suggest a bearish outlook for TAOP.
Volatility Analysis:
- Bollinger Bands: The stock price has been consistently below the lower Bollinger Band, indicating oversold conditions.
- Bollinger %B: The %B has been below 0.2, signaling potential undervaluation.
- Volatility: Volatility has been decreasing, suggesting a possible stabilization in price movement.
Key Observation: Volatility indicators imply a potential reversal or consolidation in TAOP's price.
Volume Analysis:
- On-Balance Volume (OBV): The OBV has been declining, indicating selling pressure in the stock.
- Chaikin Money Flow (CMF): The CMF has been negative, reflecting outflow of money from the stock.
Key Observation: Volume indicators support the bearish sentiment in TAOP.
Conclusion:
Based on the analysis of trend, momentum, volatility, and volume indicators, the overall outlook for TAOP suggests a continued downward movement in the stock price. The bearish trend, supported by negative momentum and volume indicators, indicates a high probability of further price decline in the coming days. Traders and investors should exercise caution and consider short-term selling strategies or wait for a potential reversal confirmation before considering long positions.
Key Conclusion: The stock is likely to experience further downside in the near term.