Technical Analysis of SYT 2024-05-10
Overview:
In analyzing the technical indicators for SYT over the last 5 days, we will delve into the trend, momentum, volatility, and volume indicators to provide a comprehensive outlook on the possible stock price movement. By examining these key factors, we aim to offer valuable insights and predictions for the upcoming days.
Trend Analysis:
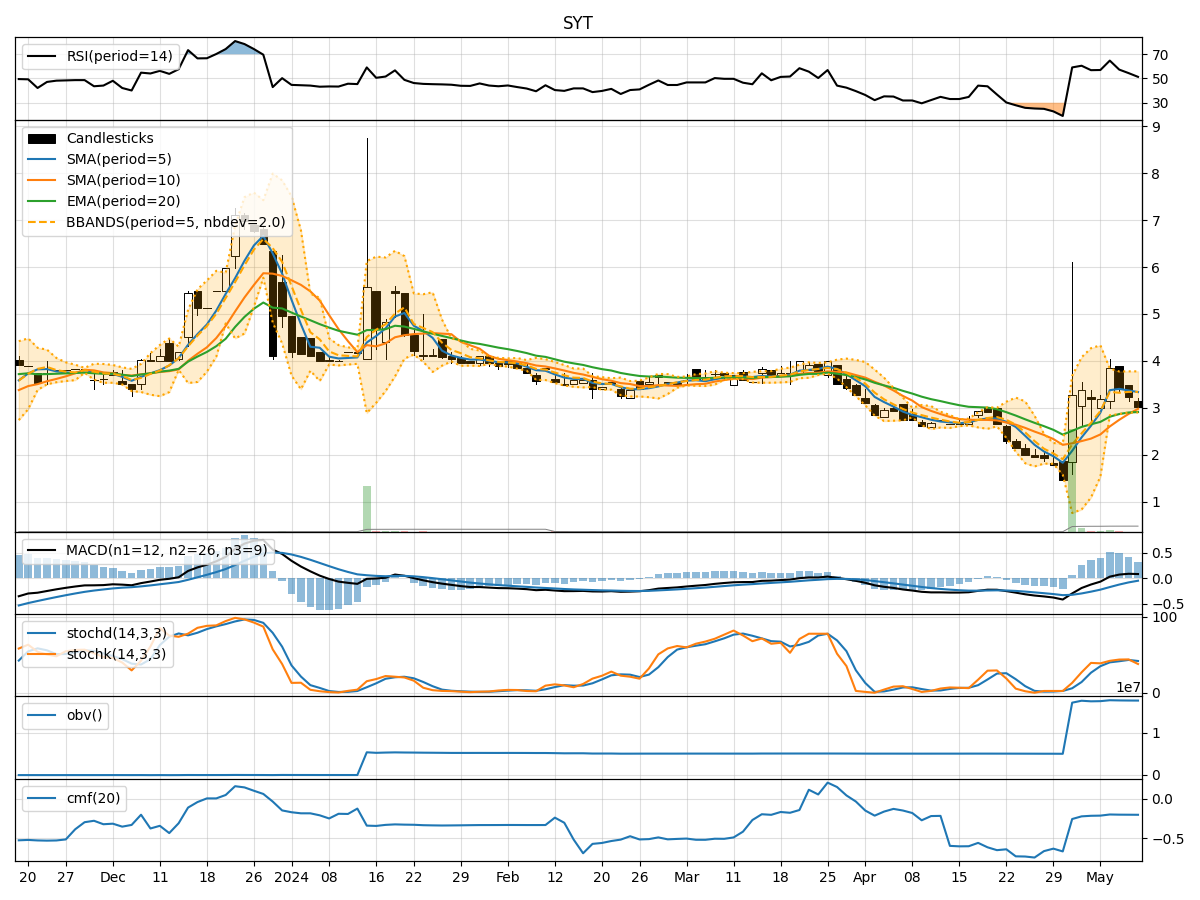
- Moving Averages (MA): The 5-day MA has been consistently above the closing prices, indicating a bullish trend.
- MACD: The MACD line has been above the signal line, suggesting a bullish momentum.
- EMA: The EMA has been trending upwards, supporting the bullish sentiment.
Key Observation: The trend indicators point towards a bullish outlook for SYT.
Momentum Analysis:
- RSI: The RSI has been fluctuating around the mid-level, indicating a neutral momentum.
- Stochastic Oscillator: Both %K and %D have been hovering around the mid-level, suggesting a lack of strong momentum.
- Williams %R: The indicator has been in the oversold territory, signaling a potential reversal.
Key Observation: The momentum indicators reflect a neutral to slightly bearish sentiment for SYT.
Volatility Analysis:
- Bollinger Bands (BB): The bands have been relatively narrow, indicating low volatility.
- Bollinger %B: The %B has been fluctuating within a tight range, reflecting stable volatility levels.
Key Observation: Volatility indicators suggest a low volatility environment for SYT.
Volume Analysis:
- On-Balance Volume (OBV): The OBV has been relatively stable, indicating a balance between buying and selling pressure.
- Chaikin Money Flow (CMF): The CMF has been negative, suggesting a slight outflow of money from the stock.
Key Observation: Volume indicators imply a balanced market sentiment for SYT.
Conclusion:
Based on the analysis of trend, momentum, volatility, and volume indicators, the overall outlook for SYT in the next few days is as follows: - Trend: Upward trend based on moving averages and MACD. - Momentum: Neutral to slightly bearish momentum based on RSI and Stochastic Oscillator. - Volatility: Low volatility environment based on Bollinger Bands. - Volume: Balanced market sentiment based on OBV and CMF.
Final Verdict:
Considering the overall analysis, while there may be some short-term fluctuations due to neutral momentum indicators, the bullish trend supported by moving averages and MACD suggests that SYT is likely to experience upward movement in the next few days. Traders should monitor key support and resistance levels for potential entry and exit points, keeping in mind the low volatility environment and balanced volume sentiment.