Technical Analysis of SY 2024-05-10
Overview:
In analyzing the technical indicators for SY over the last 5 days, we will delve into the trend, momentum, volatility, and volume indicators to provide a comprehensive outlook on the possible stock price movement in the coming days. By examining these key aspects, we aim to offer valuable insights and recommendations for potential investors.
Trend Analysis:
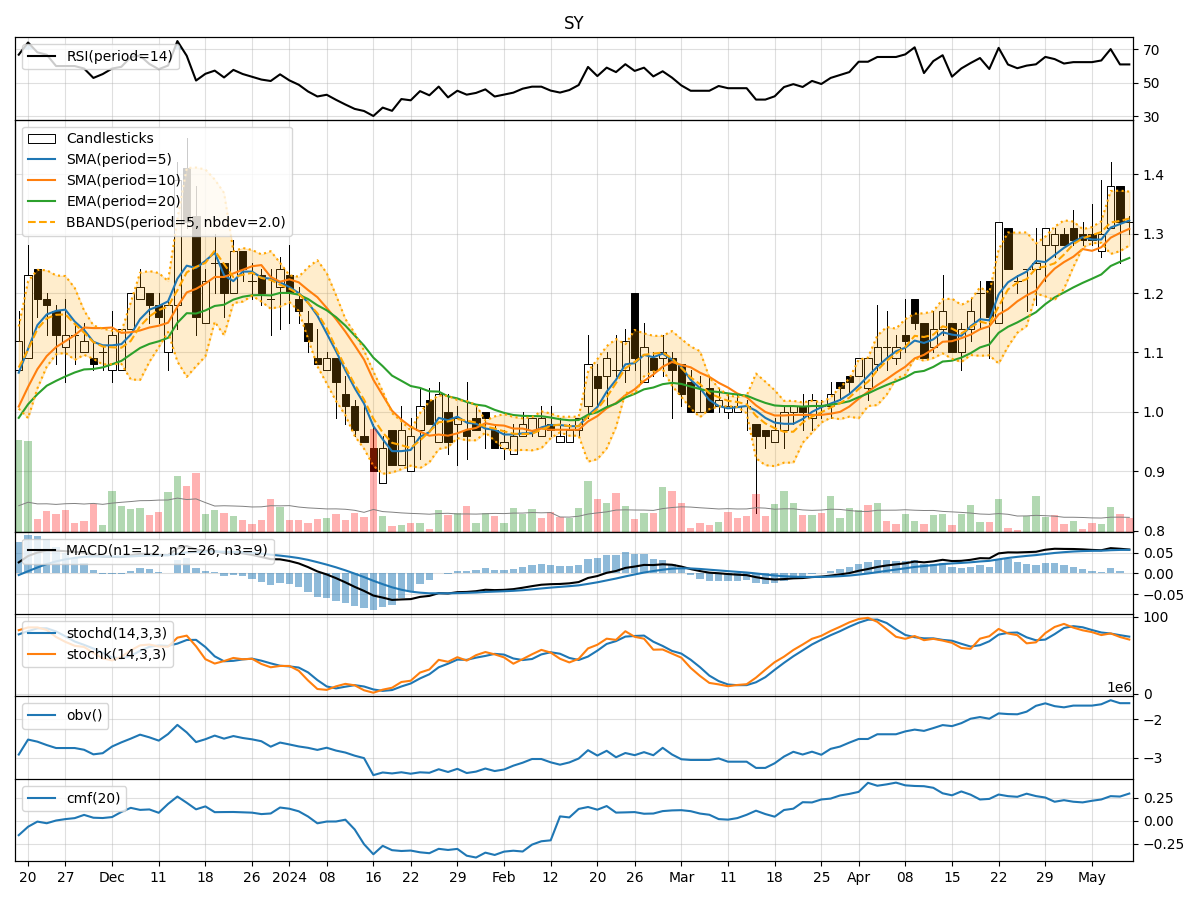
- Moving Averages (MA): The 5-day moving average has been steadily increasing, indicating a positive trend in the stock price.
- MACD: The MACD line has been consistently above the signal line, suggesting bullish momentum in the stock.
- EMA: The exponential moving average has been on an upward trajectory, further supporting the bullish sentiment.
Momentum Analysis:
- RSI: The Relative Strength Index has been fluctuating around the 60-70 range, indicating moderate momentum in the stock.
- Stochastic Oscillator: Both %K and %D have been gradually decreasing, signaling a potential reversal in momentum.
- Williams %R: The Williams %R is in oversold territory, suggesting a possible upcoming bullish reversal.
Volatility Analysis:
- Bollinger Bands: The stock price has been trading within the Bollinger Bands, indicating a period of consolidation.
- Bollinger %B: The %B indicator has been hovering around 0.5, reflecting a balanced market sentiment.
- Bollinger Band Width: The Band Width has been narrowing, suggesting a decrease in volatility and a potential breakout.
Volume Analysis:
- On-Balance Volume (OBV): The OBV has been relatively stable, indicating consistent buying pressure in the stock.
- Chaikin Money Flow (CMF): The CMF has been trending upwards, suggesting increasing buying interest in the stock.
Conclusion:
Based on the analysis of the technical indicators, the next few days for SY are likely to see upward movement in the stock price. The trend indicators, including moving averages and MACD, point towards a bullish sentiment. Momentum indicators, such as RSI and Williams %R, suggest a potential reversal to the upside. Volatility indicators indicate a period of consolidation, with a possible breakout on the horizon. Volume indicators show consistent buying pressure and increasing buying interest in the stock.
In conclusion, the overall technical outlook for SY is bullish in the short term. Investors may consider taking long positions or holding onto existing positions to capitalize on the anticipated upward movement in the stock price.