Technical Analysis of SXTC 2024-05-10
Overview:
In analyzing the technical indicators for the stock of SXTC over the last 5 days, we will delve into the trends, momentum, volatility, and volume indicators to provide a comprehensive outlook on the possible stock price movement in the coming days. By examining these key indicators, we aim to offer valuable insights and predictions for potential investors or traders.
Trend Analysis:
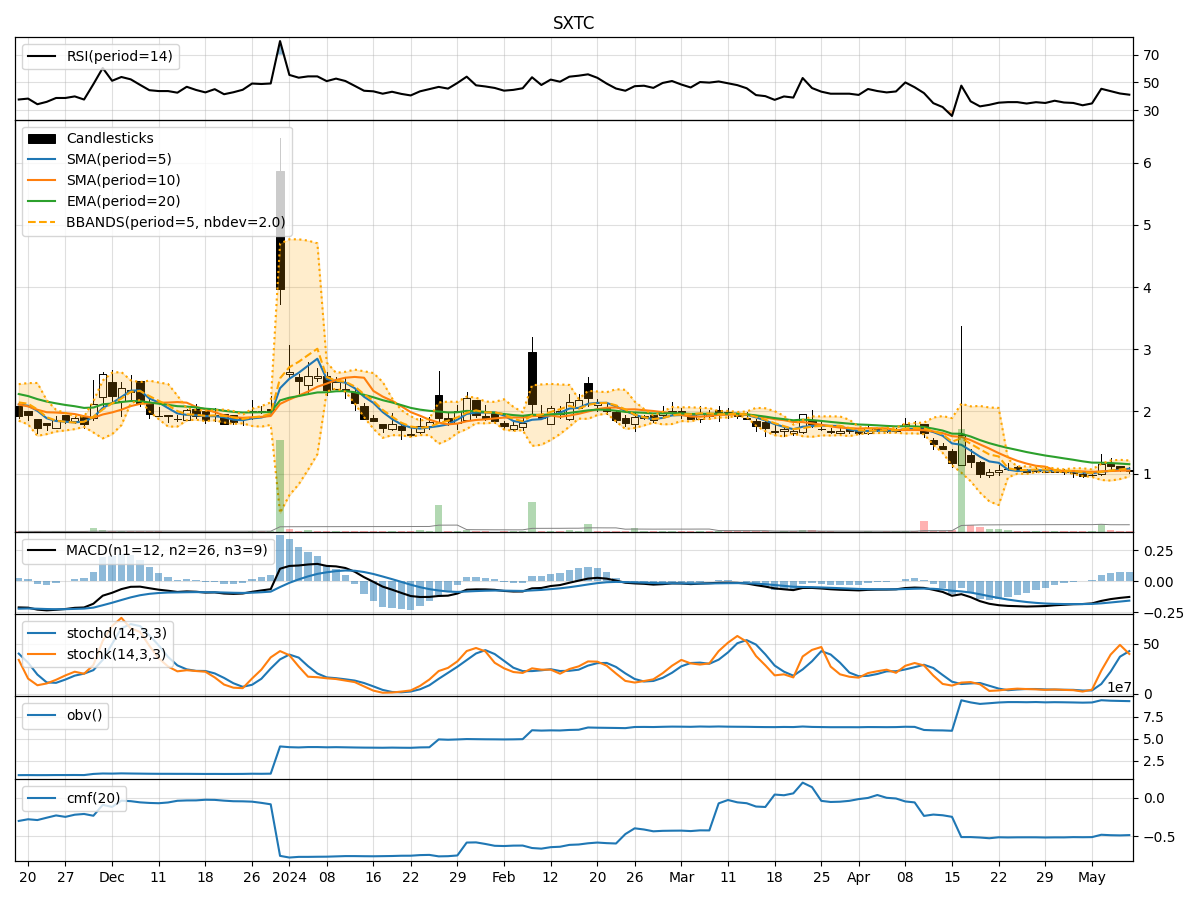
- Moving Averages (MA): The 5-day MA has been consistently below the closing prices, indicating a downward trend in the short term.
- MACD and Signal Line: The MACD has been negative but showing signs of convergence with the signal line, suggesting a potential reversal in the downward momentum.
- Relative Strength Index (RSI): The RSI has been gradually decreasing but remains above the oversold threshold, indicating a potential stabilization in the stock price.
Momentum Analysis:
- Stochastic Oscillator: Both %K and %D have been declining, indicating a bearish momentum in the stock.
- Williams %R (WillR): The Williams %R has been in the oversold territory, suggesting a potential reversal or consolidation in the stock price.
Volatility Analysis:
- Bollinger Bands (BB): The stock price has been trading within the lower Bollinger Band, indicating oversold conditions. The bands are narrowing, suggesting a potential breakout or reversal in the price trend.
Volume Analysis:
- On-Balance Volume (OBV): The OBV has been declining, indicating selling pressure in the stock.
- Chaikin Money Flow (CMF): The CMF has been negative, reflecting a lack of buying interest in the stock.
Key Observations:
- The stock has been in a downtrend based on moving averages and momentum indicators.
- Volatility is decreasing, indicating a potential consolidation phase.
- Selling pressure is evident from volume indicators, suggesting caution for buyers.
Conclusion:
Based on the analysis of technical indicators, the stock of SXTC is currently bearish in the short term. The momentum and volume indicators suggest a continuation of the downward trend, while volatility indicates a possible consolidation phase. Traders and investors should exercise caution and consider waiting for a clear reversal signal before considering long positions. Downward price movement is more likely in the next few days.