Technical Analysis of SUGP 2024-05-10
Overview:
In analyzing the technical indicators for SUGP over the last 5 days, we will delve into the trend, momentum, volatility, and volume indicators to provide a comprehensive outlook on the possible stock price movement in the coming days. By examining these key aspects, we aim to offer valuable insights and predictions to guide your investment decisions.
Trend Analysis:
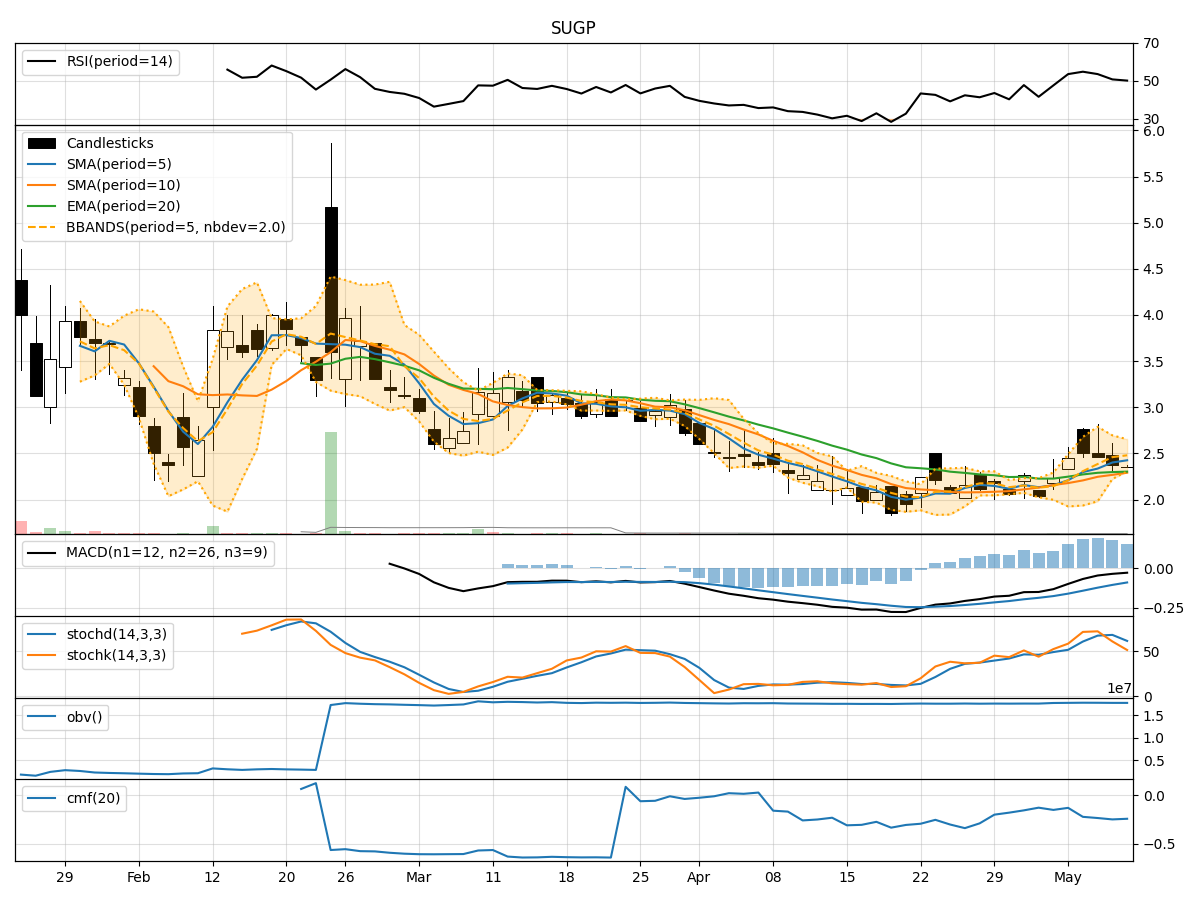
- Moving Averages (MA): The 5-day MA has been consistently above the closing prices, indicating a bullish trend.
- MACD: The MACD line has been negative but showing signs of convergence with the signal line, suggesting a potential reversal.
- RSI: The RSI has been fluctuating around the neutral zone, indicating indecision in the market sentiment.
Momentum Analysis:
- Stochastic Oscillator: The Stochastic Oscillator has been fluctuating within the range, not providing a clear signal.
- Williams %R (WillR): The Williams %R has been in oversold territory, signaling a potential buying opportunity.
Volatility Analysis:
- Bollinger Bands (BB): The stock price has been trading within the bands, indicating a period of consolidation.
- Volatility: The volatility has been decreasing, suggesting a possible decrease in price fluctuations.
Volume Analysis:
- On-Balance Volume (OBV): The OBV has been relatively stable, indicating a balance between buying and selling pressure.
- Chaikin Money Flow (CMF): The CMF has been negative, reflecting outflow of money from the stock.
Key Observations:
- The trend indicators suggest a potential reversal in the near term.
- Momentum indicators show mixed signals, requiring further confirmation.
- Volatility is decreasing, indicating a period of consolidation.
- Volume indicators reflect a balanced market sentiment with a slight bearish bias.
Conclusion:
Based on the analysis of the technical indicators, the stock price of SUGP is likely to experience sideways movement in the next few days. The trend is showing signs of a potential reversal, supported by decreasing volatility and balanced volume indicators. However, the mixed signals from momentum indicators suggest a cautious approach. Overall, the stock is expected to consolidate in the short term before establishing a clear direction.
Recommendation:
- Short-term Traders: Consider staying on the sidelines until a clear trend emerges.
- Long-term Investors: Monitor the price action closely for a potential entry point during the consolidation phase.
- Risk Management: Set stop-loss orders to protect against unexpected price movements.
By carefully monitoring the evolving market dynamics and staying informed about key technical indicators, investors can make well-informed decisions to navigate the stock market effectively.