Technical Analysis of STOK 2024-05-03
Overview:
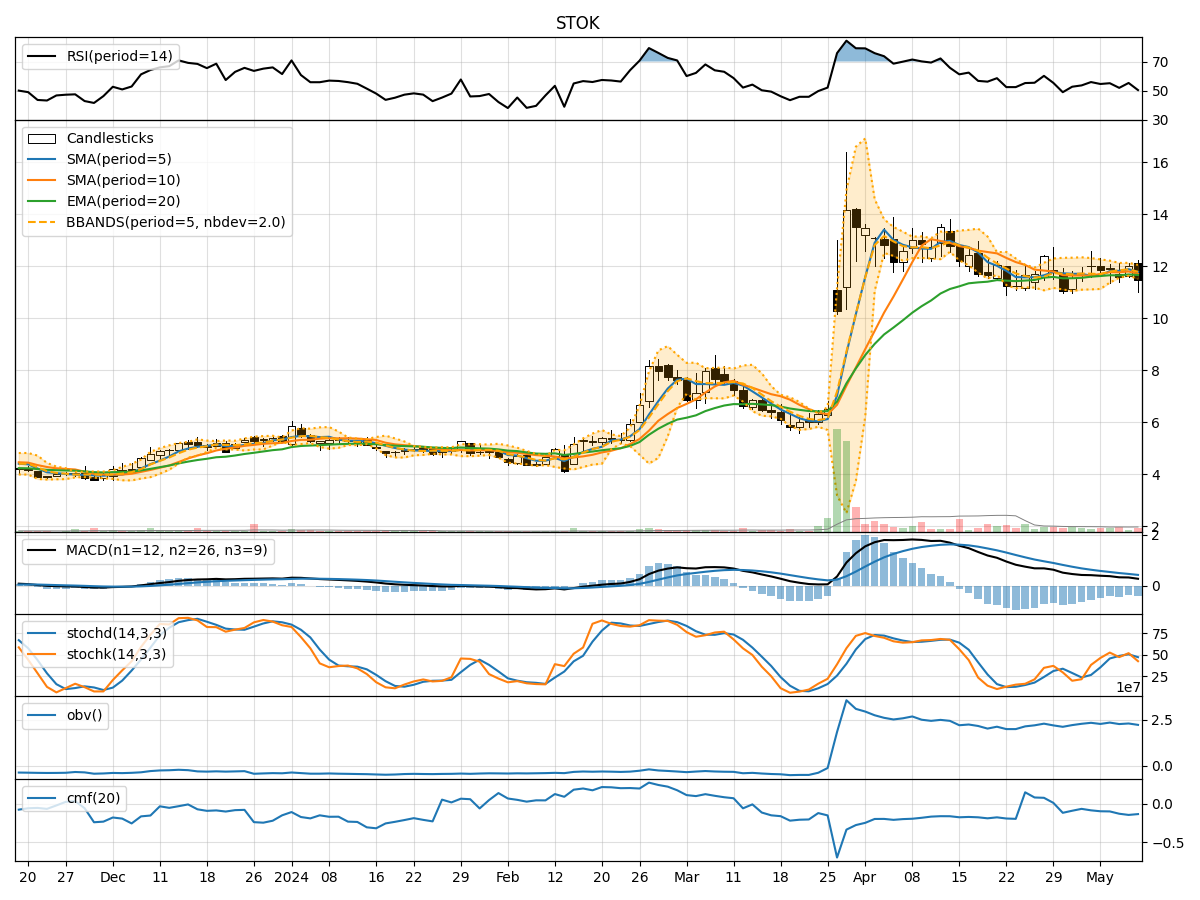
In the last 5 trading days, the stock has shown mixed signals across various technical indicators. The trend indicators suggest a neutral to slightly bearish sentiment, while momentum indicators show a potential for a reversal. Volatility indicators indicate a narrowing of price range, and volume indicators reflect a slight increase in selling pressure. Let's delve deeper into each category of indicators to provide a comprehensive analysis and make a prediction for the next few days.
Trend Indicators:
- Moving Averages (MA): The 5-day MA is hovering around the closing prices, indicating a short-term equilibrium. The SMA(10) and EMA(20) are slightly below the current price, suggesting a potential downward pressure.
- MACD: The MACD line is positive, but the MACD Histogram is negative, indicating a weakening bullish momentum.
- Conclusion: The trend indicators point towards a sideways to slightly bearish outlook for the stock.
Momentum Indicators:
- RSI: The RSI is in the neutral zone, indicating a balanced market sentiment.
- Stochastic Oscillator: Both %K and %D are below 50, suggesting a potential oversold condition.
- Williams %R: The indicator is moving towards the oversold territory.
- Conclusion: Momentum indicators hint at a possible reversal or consolidation in the near term.
Volatility Indicators:
- Bollinger Bands: The bands are narrowing, indicating decreasing volatility and a potential price breakout.
- Conclusion: Volatility indicators suggest a potential breakout in the stock price soon.
Volume Indicators:
- On-Balance Volume (OBV): The OBV is showing a slight increase, indicating a rise in selling pressure.
- Chaikin Money Flow (CMF): The CMF is negative, suggesting a net outflow of money from the stock.
- Conclusion: Volume indicators reflect a slight increase in selling pressure.
Overall Conclusion:
Based on the analysis of trend, momentum, volatility, and volume indicators, the next few days may see a sideways to slightly bearish movement in the stock price. However, there is a potential for a reversal or consolidation in the near term, supported by the narrowing Bollinger Bands and oversold conditions in momentum indicators. Traders should closely monitor the price action for a potential breakout and consider setting stop-loss levels to manage risk.
Key Recommendations:
- Monitor Price Action: Keep a close eye on the stock's price movements for any breakout signals.
- Set Stop-Loss Levels: Implement risk management strategies to protect against unexpected price swings.
- Consider Reversal Opportunities: Look for signs of a potential reversal based on momentum indicators.
- Stay Informed: Stay updated on market news and events that could impact the stock's performance.
Disclaimer:
Remember that market conditions can change rapidly, and technical analysis is just one tool in a trader's arsenal. It's essential to consider other factors and conduct thorough research before making any trading decisions. Consulting with a financial advisor or conducting further analysis using advanced tools can provide additional insights tailored to your specific trading strategy.