Technical Analysis of SSSS 2024-05-31
Overview:
In analyzing the technical indicators for SSSS stock over the last 5 days, we will delve into the trend, momentum, volatility, and volume indicators to provide a comprehensive outlook on the possible stock price movement in the coming days. By examining these key indicators, we aim to offer valuable insights and predictions for potential investors.
Trend Analysis:
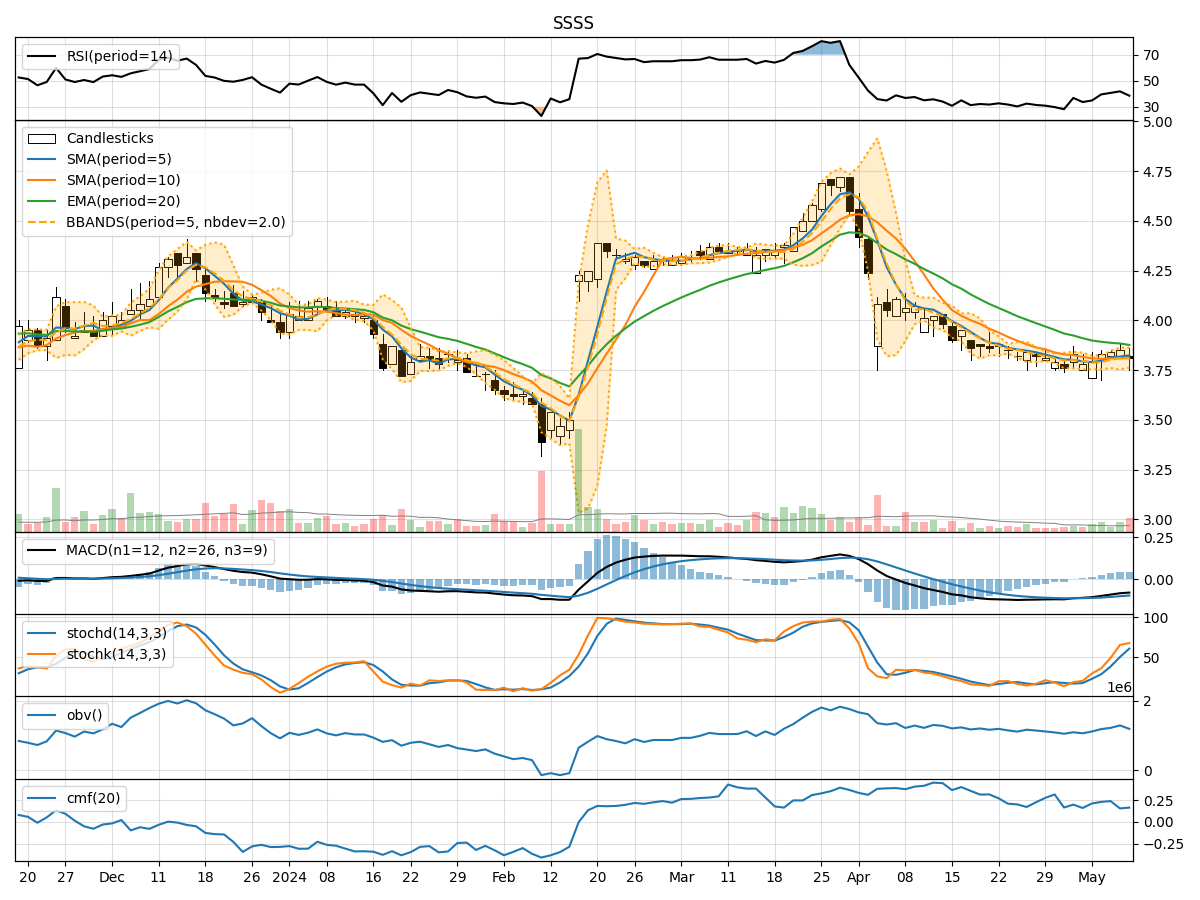
- Moving Averages (MA): The 5-day Moving Average (MA) has been relatively stable around the $4.12 mark, indicating a neutral trend.
- MACD: The Moving Average Convergence Divergence (MACD) shows a slight positive momentum with the MACD line crossing above the signal line.
- EMA: The Exponential Moving Average (EMA) has been gradually increasing, suggesting a bullish trend.
Key Observation: The trend indicators point towards a slightly bullish sentiment in the short term.
Momentum Analysis:
- RSI: The Relative Strength Index (RSI) has been hovering around the neutral zone, indicating a balanced momentum.
- Stochastic Oscillator: Both %K and %D lines of the Stochastic Oscillator are in the oversold region, suggesting a potential reversal.
- Williams %R: The Williams %R is also in the oversold territory, signaling a possible buying opportunity.
Key Observation: Momentum indicators suggest a potential reversal or a short-term bullish momentum.
Volatility Analysis:
- Bollinger Bands: The Bollinger Bands show a widening of the bands, indicating increased volatility in the stock price.
- Bollinger %B: The %B indicator is fluctuating within a wide range, reflecting the heightened volatility.
- Average True Range (ATR): The ATR value has increased, indicating a rise in volatility levels.
Key Observation: Volatility indicators suggest a period of increased price fluctuations and potential trading opportunities.
Volume Analysis:
- On-Balance Volume (OBV): The OBV has shown a slight increase over the past few days, indicating buying pressure.
- Chaikin Money Flow (CMF): The CMF is positive, suggesting that money is flowing into the stock.
Key Observation: Volume indicators point towards a positive sentiment with increasing buying interest.
Conclusion:
Based on the analysis of the trend, momentum, volatility, and volume indicators, the overall outlook for SSSS stock in the next few days is bullish. The trend indicators show a potential bullish trend, supported by positive momentum signals and increasing buying interest as indicated by volume indicators. However, the heightened volatility suggests that traders should be cautious and consider risk management strategies.
Key Conclusion: The stock is likely to experience an upward movement in the coming days, presenting a potential buying opportunity for investors looking to capitalize on the bullish momentum.