Technical Analysis of SSBI 2024-05-31
Overview:
In analyzing the technical indicators for SSBI over the last 5 days, we will delve into the trend, momentum, volatility, and volume indicators to provide a comprehensive outlook on the possible stock price movement. By examining these key aspects, we aim to offer valuable insights and predictions for the upcoming days.
Trend Analysis:
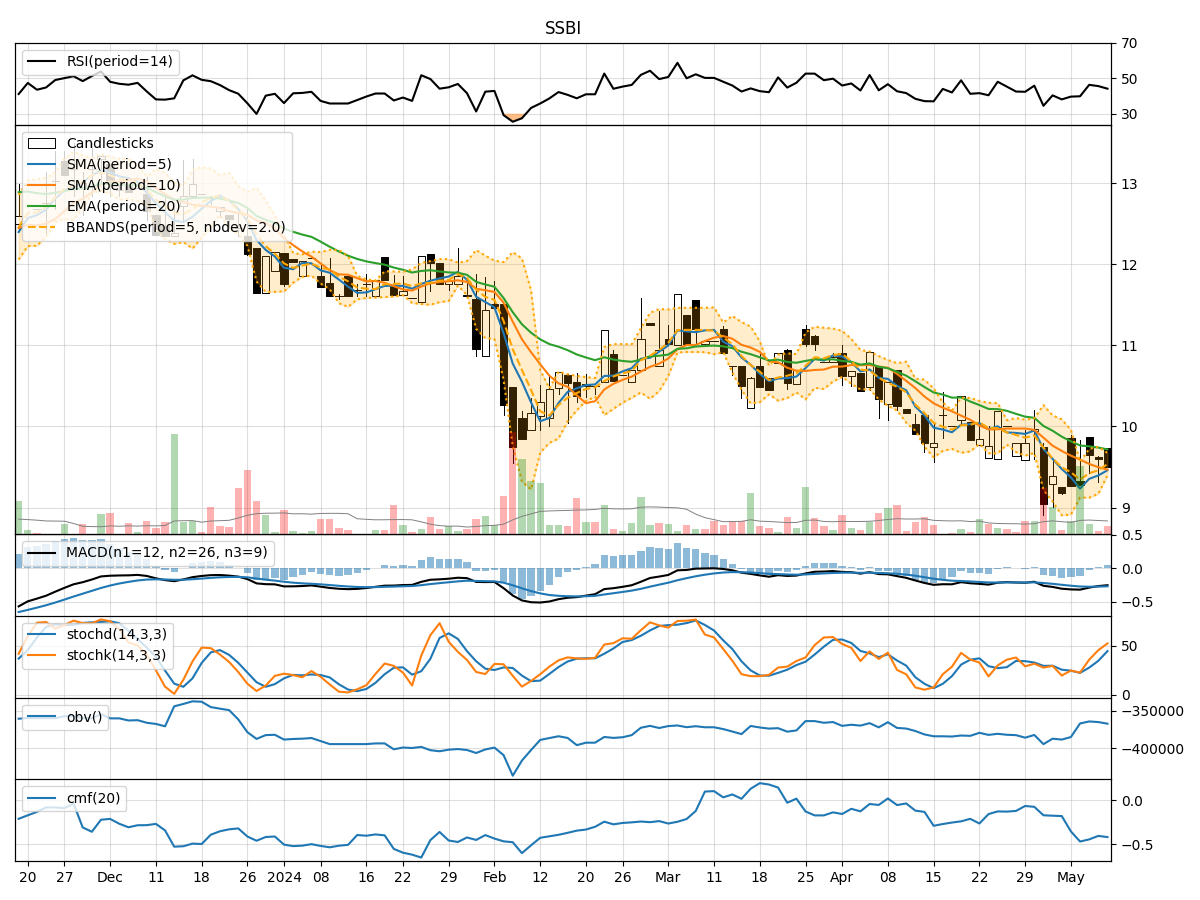
- Moving Averages (MA): The 5-day Moving Average (MA) has been fluctuating around the closing prices, indicating short-term price trends. The Simple Moving Average (SMA) and Exponential Moving Average (EMA) have shown slight variations but have generally followed the price movements.
- MACD: The Moving Average Convergence Divergence (MACD) has been negative, suggesting a bearish momentum in the stock price. The MACD Histogram (MACDH) has been positive, indicating potential bullish momentum.
Momentum Analysis:
- RSI: The Relative Strength Index (RSI) has been hovering around the mid-level, indicating a neutral stance in momentum. There is no extreme overbought or oversold conditions.
- Stochastic Oscillator: Both %K and %D values have been declining, suggesting a weakening momentum in the stock price. The Williams %R (Willams %R) has been in the oversold territory, indicating a potential reversal.
Volatility Analysis:
- Bollinger Bands (BB): The Bollinger Bands have shown narrowing bands, indicating decreasing volatility in the stock price. The %B indicator has been fluctuating around the mid-level, suggesting a balanced market sentiment.
Volume Analysis:
- On-Balance Volume (OBV): The OBV indicator has been declining, indicating a potential distribution phase where selling pressure might be increasing.
- Chaikin Money Flow (CMF): The CMF has been negative, suggesting that money flow has been predominantly negative over the past 20 days.
Key Observations:
- The trend indicators show a mixed signal with the MACD indicating bearish momentum while the MACD Histogram suggests a potential bullish reversal.
- Momentum indicators point towards a neutral to slightly bearish sentiment with no extreme overbought or oversold conditions.
- Volatility has been decreasing, indicating a possible period of consolidation or a calm before a potential price movement.
- Volume indicators reflect a negative money flow and increasing selling pressure.
Conclusion:
Based on the analysis of the technical indicators, the stock price of SSBI is likely to experience further downward movement in the next few days. The bearish signal from the MACD, declining momentum in the Stochastic Oscillator, negative OBV, and decreasing volatility all point towards a potential continuation of the current downtrend. Traders and investors should exercise caution and consider short-term selling strategies or wait for a clearer bullish reversal signal before considering long positions.