Technical Analysis of SPCB 2024-05-10
Overview:
In analyzing the technical indicators for SPCB over the last 5 days, we will delve into the trend, momentum, volatility, and volume indicators to provide a comprehensive outlook on the possible stock price movement in the coming days. By examining these key aspects, we aim to offer valuable insights and predictions for potential investors.
Trend Analysis:
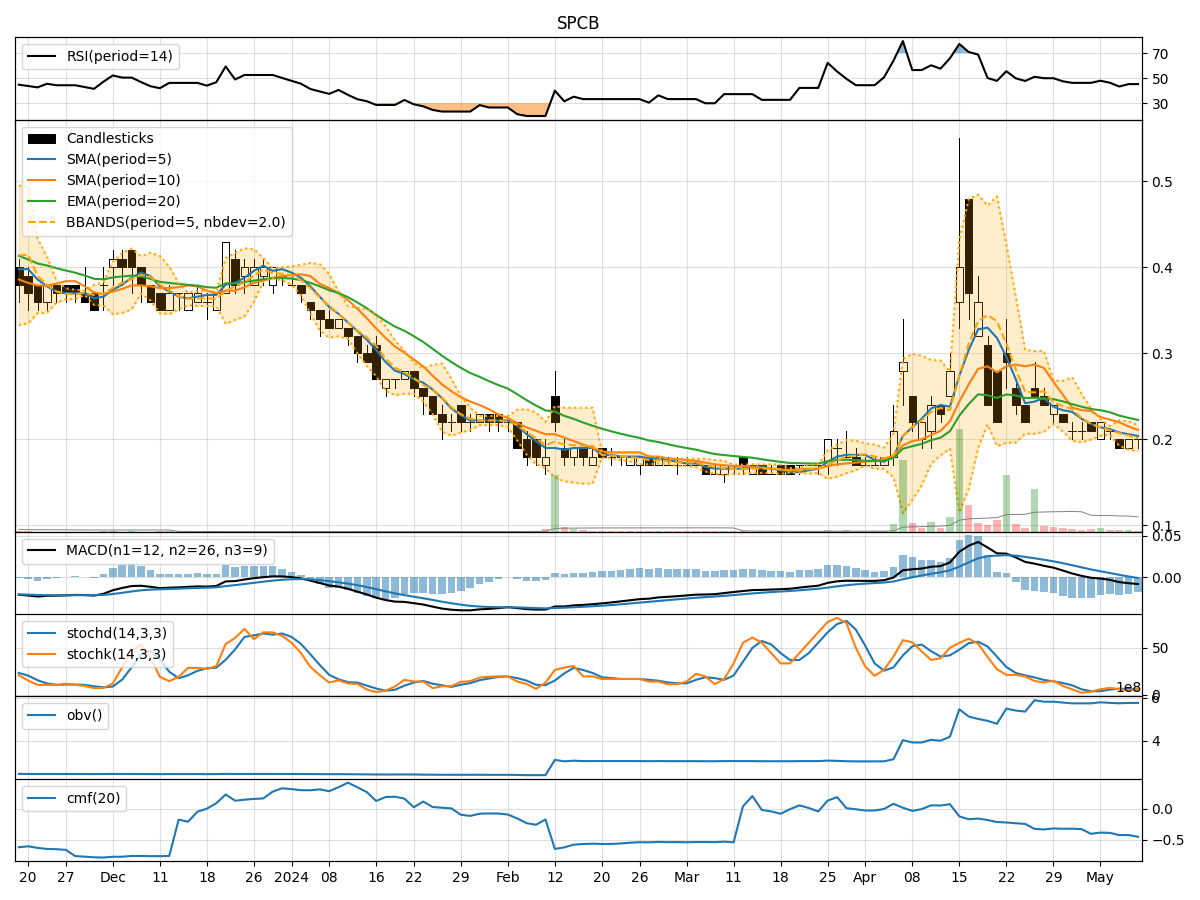
- Moving Averages (MA): The 5-day MA has been consistently declining, indicating a downward trend in the stock price.
- MACD: The MACD line has been negative, with the MACD histogram also showing a downward trend, suggesting bearish momentum.
Key Observation: The stock is currently in a downtrend based on the moving averages and MACD indicators.
Momentum Analysis:
- RSI: The RSI has been hovering around the mid-range, indicating a lack of strong momentum in either direction.
- Stochastic Oscillator: Both %K and %D have been relatively low, reflecting a lack of strong buying or selling pressure.
Key Observation: Momentum indicators suggest a neutral stance with no clear direction.
Volatility Analysis:
- Bollinger Bands (BB): The stock price has been trading close to the lower Bollinger Band, indicating lower volatility.
Key Observation: Volatility is low, and the stock price is currently at the lower end of its recent price range.
Volume Analysis:
- On-Balance Volume (OBV): The OBV has been relatively stable, indicating no significant accumulation or distribution of the stock.
- Chaikin Money Flow (CMF): The CMF has been negative, suggesting a lack of buying pressure.
Key Observation: Volume indicators point towards a lack of strong buying interest in the stock.
Conclusion:
Based on the analysis of the technical indicators, the stock of SPCB is currently bearish in trend, with neutral momentum, low volatility, and weak volume support. Considering these factors, the next few days are likely to see the stock price continue its downward trajectory or consolidate at lower levels. Investors should exercise caution and consider waiting for a more definitive signal before making any trading decisions.