Technical Analysis of SNDL 2024-05-03
Overview:
In analyzing the technical indicators for SNDL over the last 5 days, we will delve into the trend, momentum, volatility, and volume indicators to provide a comprehensive outlook on the possible stock price movement in the coming days. By examining these key aspects, we aim to offer valuable insights and predictions for potential investors.
Trend Analysis:
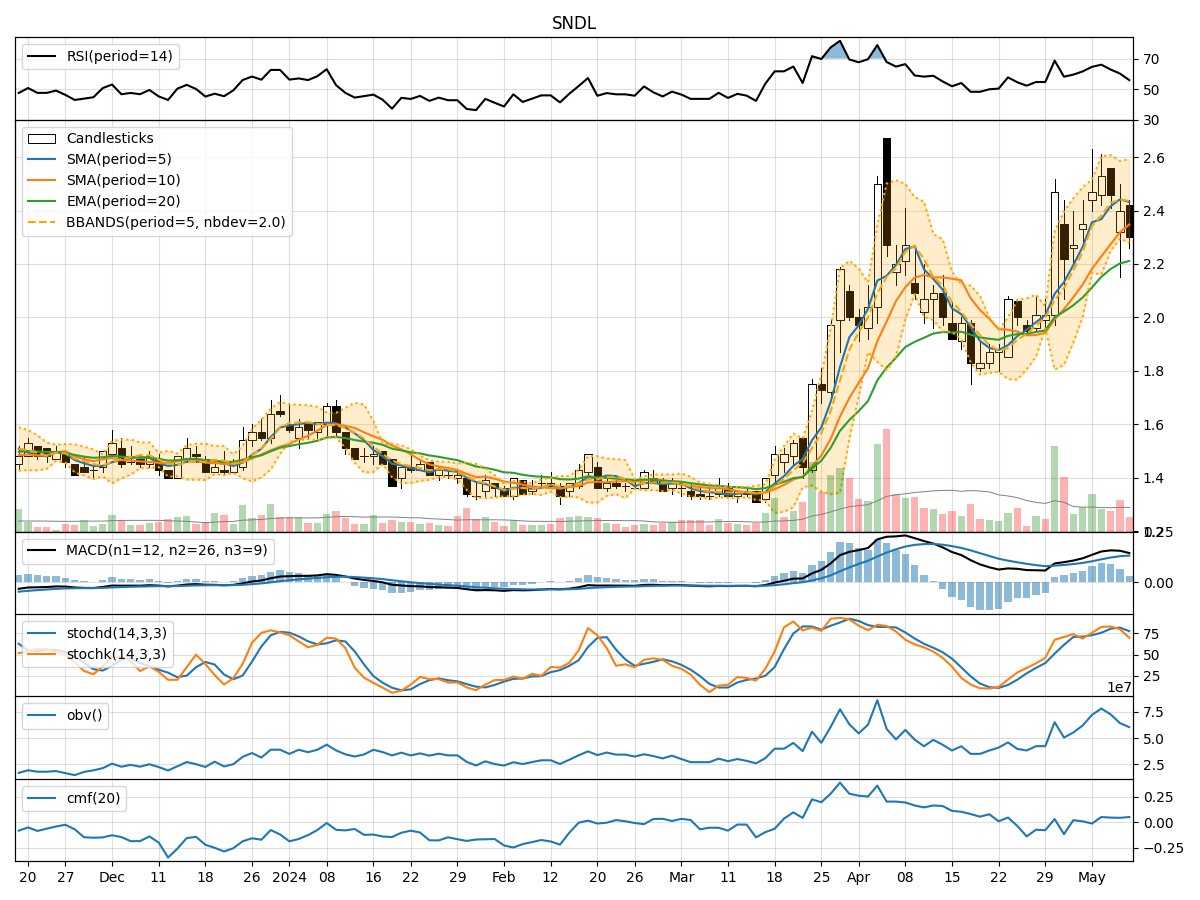
- Moving Averages (MA): The moving averages have been showing an upward trend, with the 5-day MA consistently above the 10-day SMA, indicating a positive momentum in the stock price.
- MACD: The MACD line has been consistently above the signal line, with both lines showing an upward trajectory, suggesting bullish momentum in the stock.
Momentum Analysis:
- RSI: The RSI has been fluctuating around the 50 level, indicating a neutral stance in terms of momentum.
- Stochastic Oscillator: The stochastic indicators have been in the overbought territory, suggesting a potential reversal or consolidation phase.
Volatility Analysis:
- Bollinger Bands (BB): The Bollinger Bands have been widening, indicating increased volatility in the stock price.
Volume Analysis:
- On-Balance Volume (OBV): The OBV has been showing mixed signals, with fluctuations in volume accumulation.
- Chaikin Money Flow (CMF): The CMF has been hovering around the zero line, indicating a balance between buying and selling pressure.
Key Observations:
- The trend indicators suggest a bullish sentiment in the stock price, supported by the moving averages and MACD.
- Momentum indicators show a neutral stance, with the RSI indicating a lack of strong buying or selling pressure.
- Volatility has been increasing, as seen in the widening Bollinger Bands, which could lead to larger price swings.
- Volume indicators are inconclusive, with mixed signals from OBV and CMF.
Conclusion:
Based on the analysis of the technical indicators, the stock price of SNDL is likely to experience further upward movement in the coming days. The bullish trend indicated by the moving averages and MACD, coupled with the increasing volatility, suggests potential price appreciation. However, investors should remain cautious of the overbought levels in the stochastic oscillator and monitor volume accumulation closely for confirmation of the bullish trend. Overall, the outlook for SNDL appears bullish in the short term.