Technical Analysis of SLNA 2024-05-10
Overview:
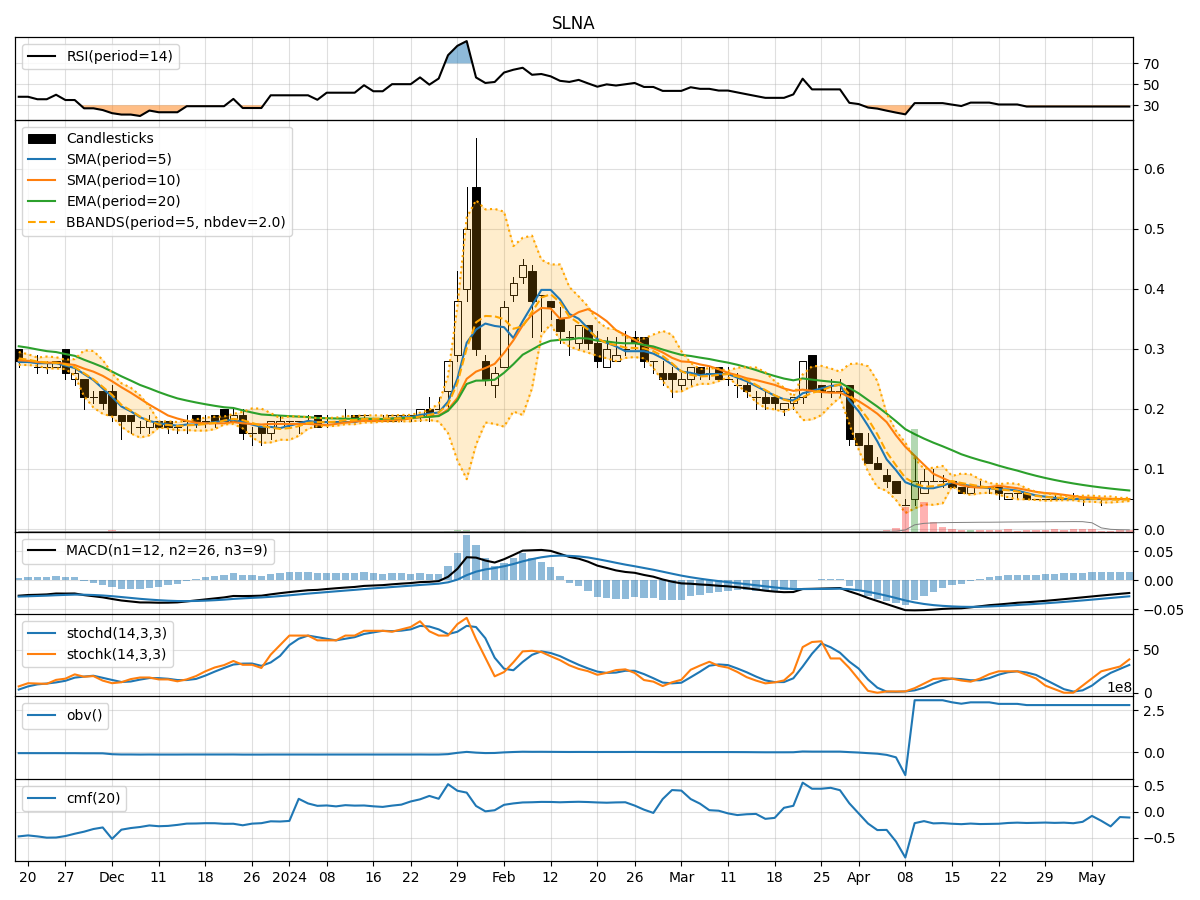
In analyzing the technical indicators for SLNA over the last 5 days, we will delve into the trend, momentum, volatility, and volume indicators to provide a comprehensive outlook on the possible stock price movement. By examining these key indicators, we aim to offer valuable insights and predictions for the upcoming days.
Trend Analysis:
- Moving Averages (MA): The 5-day Moving Average (MA) has been consistently at 0.05, indicating a stable price trend in the short term.
- MACD: The Moving Average Convergence Divergence (MACD) has been negative but showing a slight increase over the days, suggesting a potential reversal in the bearish momentum.
- EMA: The Exponential Moving Average (EMA) has been declining, reflecting a bearish sentiment in the stock.
Momentum Analysis:
- RSI: The Relative Strength Index (RSI) has been around 26.38, indicating an oversold condition but not yet showing signs of a reversal.
- Stochastic Oscillator: Both %K and %D have been gradually increasing, hinting at a possible bullish momentum building up.
- Williams %R: The Williams %R is in the oversold territory, but it has not shown a clear signal for a reversal.
Volatility Analysis:
- Bollinger Bands: The Bollinger Bands are tight around the price, suggesting low volatility and a potential breakout in either direction.
- Bollinger %B: The %B is at 1.0, indicating that the price is at the upper band, which could signal a potential reversal or continuation of an uptrend.
Volume Analysis:
- On-Balance Volume (OBV): The OBV has been relatively flat, indicating a balance between buying and selling pressure.
- Chaikin Money Flow (CMF): The CMF has been negative, reflecting a lack of buying interest in the stock.
Key Observations:
- The stock has been trading in a tight range with low volatility.
- The momentum indicators suggest a potential shift towards a bullish sentiment.
- The volume indicators do not show a clear direction in buying or selling pressure.
Conclusion:
Based on the analysis of the technical indicators, the next few days for SLNA could see sideways movement with a potential bullish bias. Traders should closely monitor the MACD for a bullish crossover, RSI for a move above 30, and %K/%D for a bullish crossover to confirm a potential uptrend. Additionally, a breakout above the upper Bollinger Band could signal a continuation of the bullish momentum. However, it is essential to exercise caution and wait for confirmation from multiple indicators before making trading decisions.