Technical Analysis of SLGL 2024-05-10
Overview:
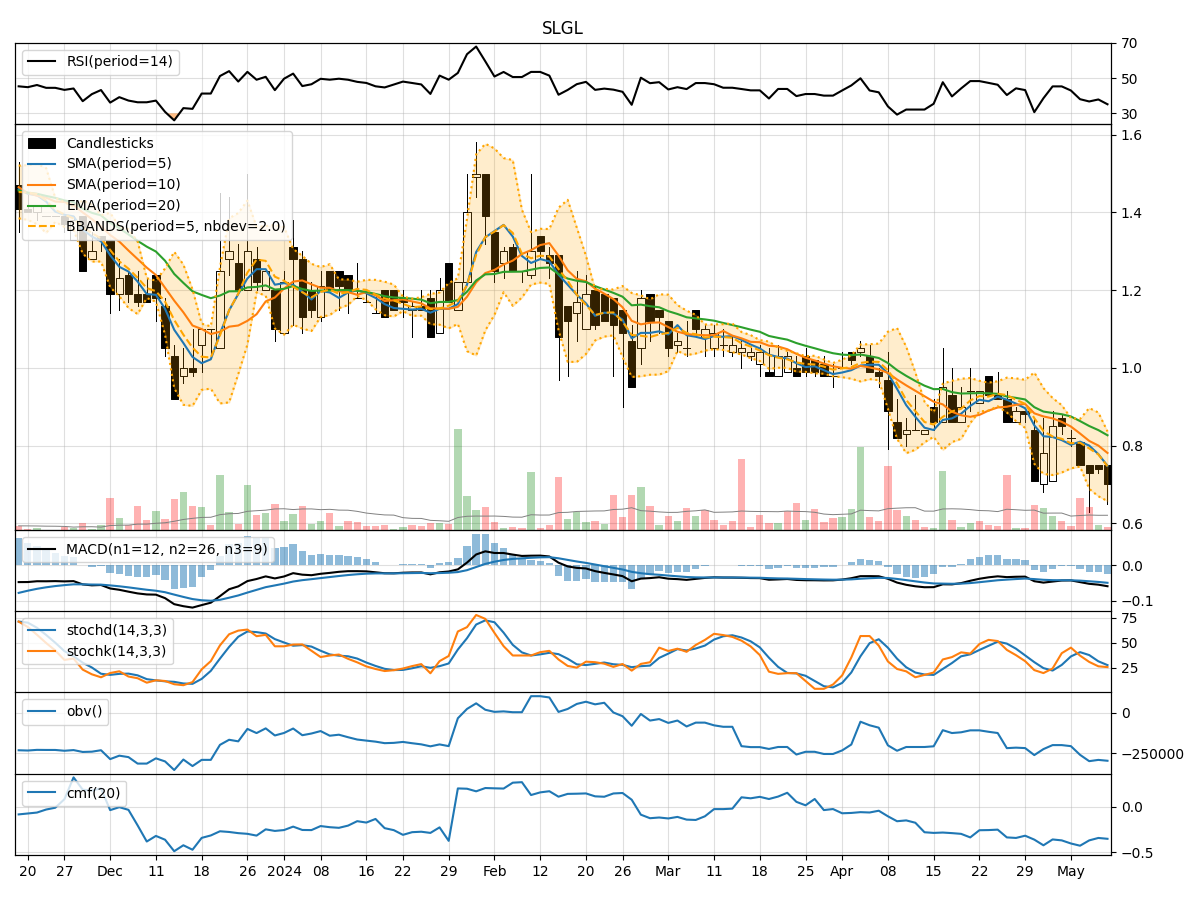
In analyzing the technical indicators for SLGL over the last 5 days, we will delve into the trend, momentum, volatility, and volume indicators to provide a comprehensive outlook on the possible stock price movement in the coming days.
Trend Analysis:
- Moving Averages (MA): The 5-day MA has been consistently below the closing price, indicating a downward trend.
- MACD: The MACD line has been negative and decreasing, suggesting bearish momentum.
- EMA: The EMA has been declining, further supporting the bearish trend.
Momentum Analysis:
- RSI: The RSI has been below 50, indicating bearish momentum.
- Stochastic Oscillator: Both %K and %D have been in oversold territory, signaling a potential reversal.
- Williams %R: The indicator has been in oversold territory, reflecting bearish sentiment.
Volatility Analysis:
- Bollinger Bands (BB): The stock price has been consistently below the lower Bollinger Band, indicating oversold conditions.
- Bollinger Band Width (BBW): The BBW has been narrowing, suggesting a potential decrease in volatility.
Volume Analysis:
- On-Balance Volume (OBV): The OBV has been declining, indicating selling pressure.
- Chaikin Money Flow (CMF): The CMF has been negative, reflecting outflow of money from the stock.
Key Observations:
- The stock is currently in a downtrend based on moving averages and MACD.
- Momentum indicators suggest bearish sentiment with oversold conditions.
- Volatility is decreasing, indicating a potential stabilization in price movement.
- Volume indicators show selling pressure with a negative OBV and CMF.
Conclusion:
Based on the analysis of technical indicators, the next few days are likely to see the stock price continue its downward movement. The bearish trend is supported by the MA, MACD, RSI, and stochastic indicators. However, the narrowing Bollinger Bands suggest a possible consolidation in the near term. Investors should exercise caution and consider waiting for a clearer signal before making any trading decisions.