Technical Analysis of SHLT 2024-05-10
Overview:
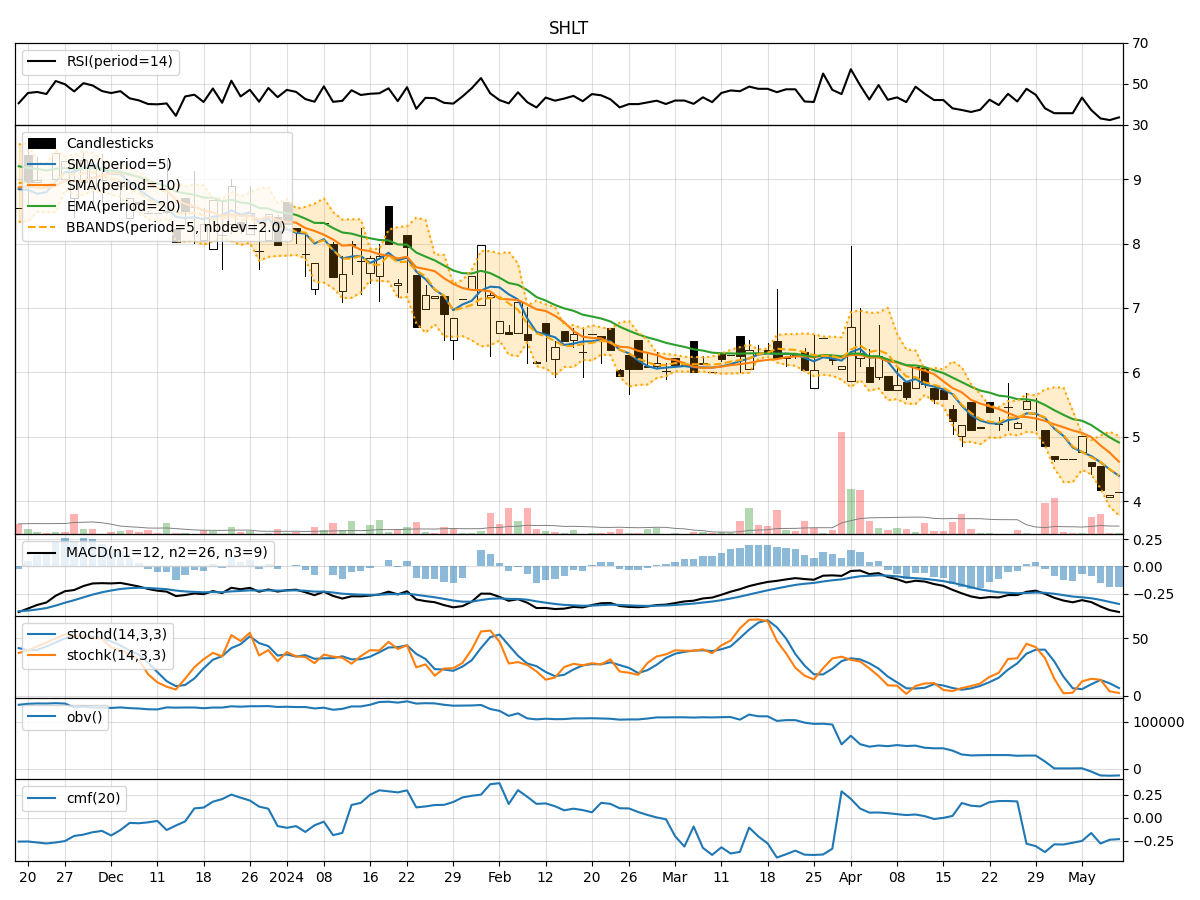
In analyzing the technical indicators for SHLT over the last 5 days, we will delve into the trend, momentum, volatility, and volume indicators to provide a comprehensive outlook on the possible stock price movement in the coming days.
Trend Analysis:
- Moving Averages (MA): The 5-day Moving Average (MA) has been consistently below the closing prices, indicating a downward trend.
- MACD: The Moving Average Convergence Divergence (MACD) has been negative, with the MACD line consistently below the signal line, suggesting bearish momentum.
- EMA: The Exponential Moving Average (EMA) has been declining, further supporting the bearish trend.
Momentum Analysis:
- RSI: The Relative Strength Index (RSI) has been below 50, indicating bearish momentum.
- Stochastic Oscillator: Both %K and %D have been trending downwards, signaling a bearish sentiment.
- Williams %R: The indicator has been consistently in the oversold territory, reflecting strong bearish pressure.
Volatility Analysis:
- Bollinger Bands (BB): The bands have been narrowing, suggesting decreasing volatility in the stock price.
- Bollinger %B: The %B indicator has been below 1, indicating that the stock price is trading below the lower Bollinger Band.
Volume Analysis:
- On-Balance Volume (OBV): The OBV has been declining, indicating selling pressure in the stock.
- Chaikin Money Flow (CMF): The CMF has been negative, suggesting outflow of money from the stock.
Key Observations:
- The stock is in a clear downtrend based on moving averages and MACD.
- Momentum indicators like RSI and Stochastic Oscillator confirm the bearish sentiment.
- Volatility has been decreasing, indicating stability in the stock price.
- Volume indicators show selling pressure with declining OBV and negative CMF.
Conclusion:
Based on the analysis of technical indicators, the next few days are likely to see a continuation of the bearish trend for SHLT. The stock is expected to face downward pressure with a high probability of further price declines. Traders and investors should exercise caution and consider short-term strategies aligned with the prevailing bearish market sentiment.
Recommendation:
- Short positions or put options could be considered for potential profit-taking in a bearish market.
- Monitoring key support levels and trend reversals is crucial for timely decision-making.
- Stay updated on market news and events that could impact the stock price movement.
In conclusion, the technical analysis points towards a bearish outlook for SHLT in the coming days. It is essential to stay vigilant and adapt trading strategies accordingly to navigate the market dynamics effectively.