Technical Analysis of SHIP 2024-05-10
Overview:
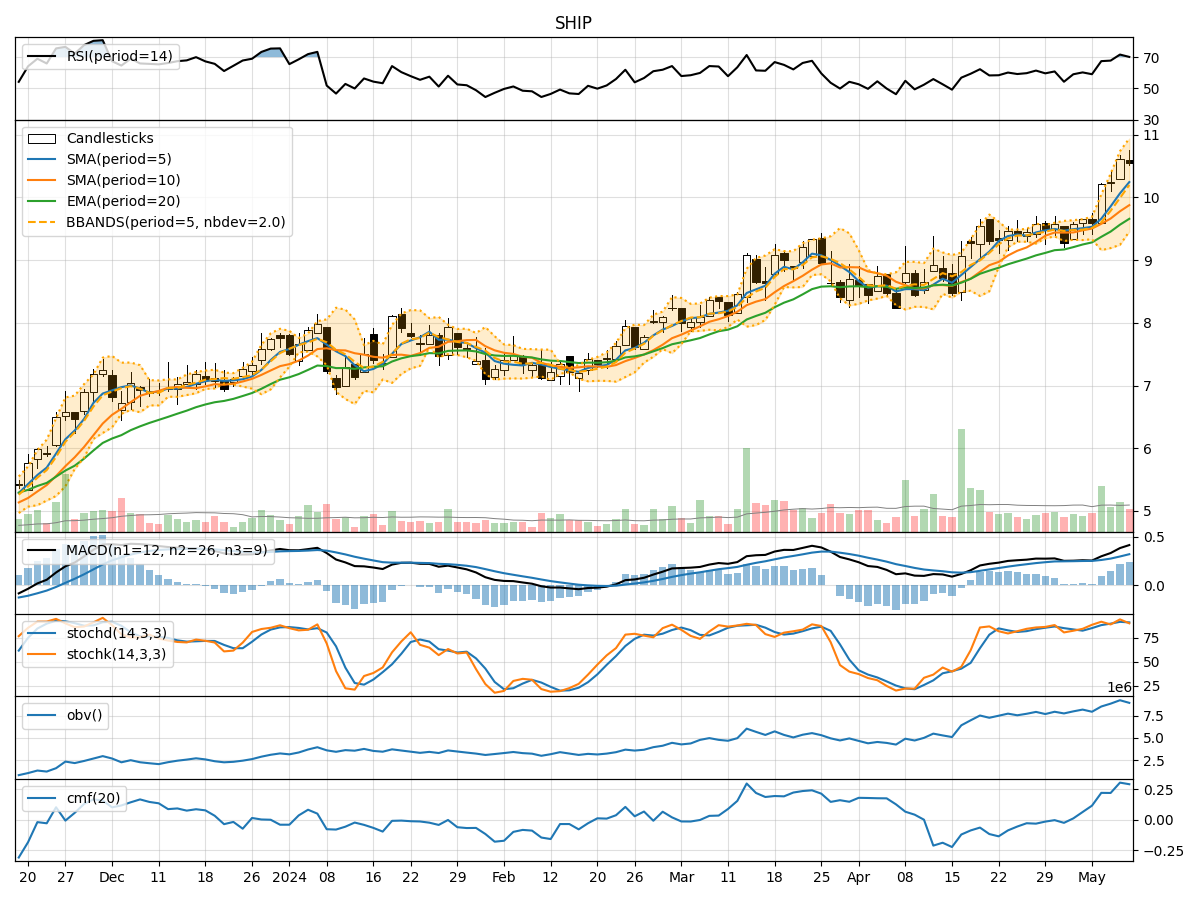
In the last 5 trading days, SHIP stock has shown a consistent upward trend in both price and volume. The moving averages have been steadily increasing, indicating a bullish momentum. Momentum indicators such as RSI and Stochastic oscillators suggest that the stock is currently in overbought territory. Volatility indicators like Bollinger Bands show an expanding range, while volume indicators like OBV and CMF confirm the buying pressure.
Trend Analysis:
- Moving Averages (MA): The 5-day MA has been consistently above the 10-day SMA, indicating a short-term bullish trend. The EMA(20) has also been rising steadily, supporting the bullish sentiment.
- MACD: The MACD line has been above the signal line for the past 5 days, with the MACD histogram showing an increasing positive value. This suggests strong bullish momentum.
Momentum Analysis:
- RSI: The RSI has been trending upwards and is currently in the overbought zone, indicating a potential reversal or consolidation in the near future.
- Stochastic Oscillators: Both %K and %D lines are in the overbought region, signaling a potential pullback or correction.
Volatility Analysis:
- Bollinger Bands (BB): The Bollinger Bands have been widening, indicating increasing volatility in the stock price. The current price is near the upper band, suggesting a potential reversal or consolidation.
Volume Analysis:
- On-Balance Volume (OBV): The OBV has been steadily increasing, indicating strong buying pressure and accumulation of the stock.
- Chaikin Money Flow (CMF): The CMF is positive, indicating that money is flowing into the stock.
Conclusion:
Based on the technical indicators and analysis: - Trend: The stock is in a strong upward trend, supported by moving averages and MACD. - Momentum: The stock is currently overbought, suggesting a potential pullback or consolidation. - Volatility: Increasing volatility may lead to a period of consolidation or a reversal in the stock price. - Volume: Strong buying pressure indicated by OBV and positive CMF.
Overall View:
Given the overbought conditions and increasing volatility, the stock is likely to experience a short-term pullback or consolidation in the next few days. Traders should exercise caution and consider taking profits or implementing risk management strategies. Long-term investors may use any pullback as a buying opportunity, considering the overall bullish trend in the stock.