Technical Analysis of SFWL 2024-05-10
Overview:
In analyzing the technical indicators for SFWL over the last 5 days, we will delve into the trend, momentum, volatility, and volume indicators to provide a comprehensive outlook on the possible stock price movement in the coming days. By examining these key indicators, we aim to offer valuable insights and recommendations for potential investors.
Trend Analysis:
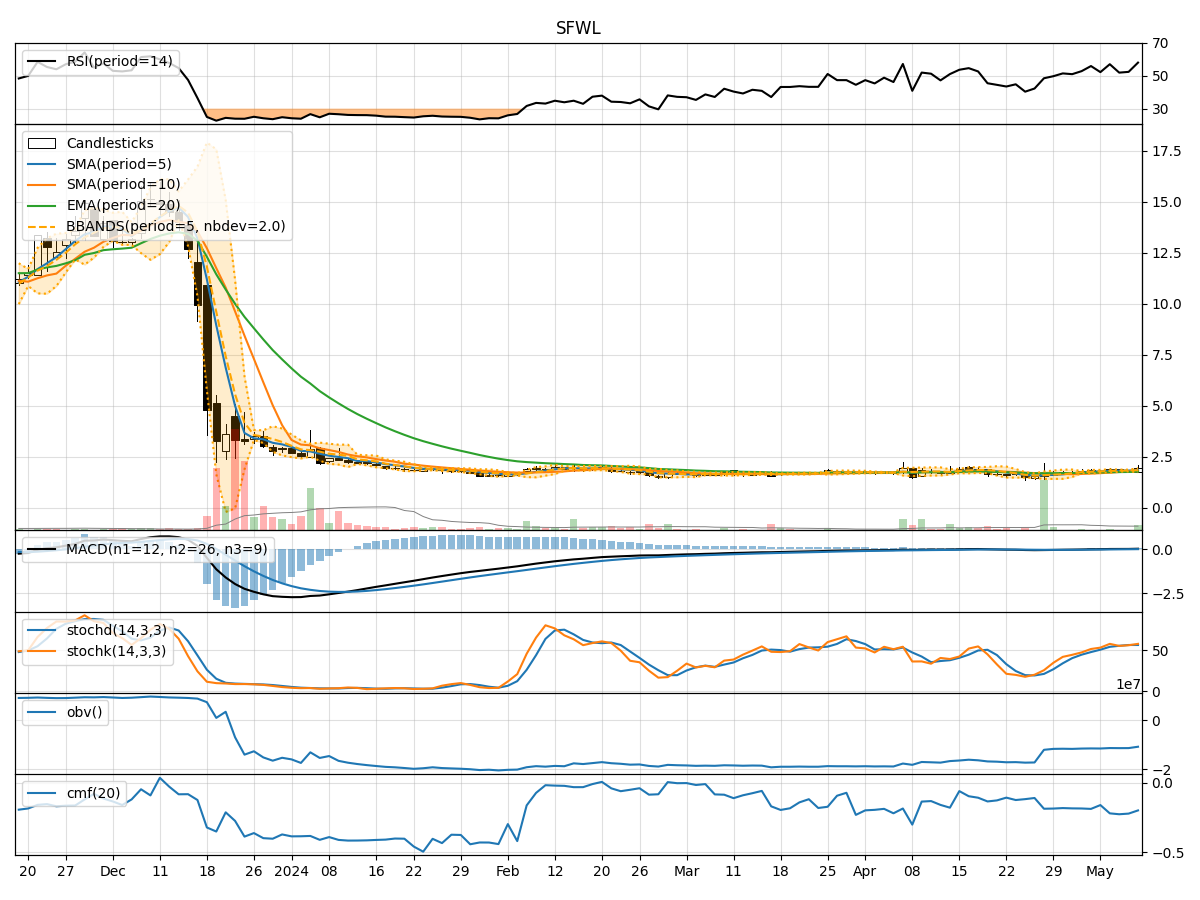
- Moving Averages (MA): The 5-day Moving Average (MA) has been showing an upward trend, indicating a positive momentum in the stock price.
- MACD: The Moving Average Convergence Divergence (MACD) has been consistently positive, suggesting a bullish trend in the stock.
- EMA: The Exponential Moving Average (EMA) has been trending upwards, supporting the bullish sentiment in the stock.
Momentum Analysis:
- RSI: The Relative Strength Index (RSI) has been fluctuating around the neutral zone, indicating a balanced momentum in the stock.
- Stochastic Oscillator: Both %K and %D of the Stochastic Oscillator have been in the overbought territory, suggesting a potential reversal in the stock price.
- Williams %R: The Williams %R is also in the overbought region, signaling a possible correction in the stock price.
Volatility Analysis:
- Bollinger Bands: The Bollinger Bands are widening, indicating increased volatility in the stock price.
- Bollinger %B: The %B indicator is above 0.8, suggesting that the stock is trading near the upper band, potentially indicating an overbought condition.
Volume Analysis:
- On-Balance Volume (OBV): The OBV has been relatively stable, indicating a neutral volume flow in the stock.
- Chaikin Money Flow (CMF): The CMF has been negative, suggesting a bearish pressure on the stock price.
Key Observations and Opinions:
- Trend: The stock is currently in an upward trend based on the moving averages and MACD.
- Momentum: The momentum indicators are showing signs of overbought conditions, indicating a potential reversal or correction.
- Volatility: The widening Bollinger Bands suggest increased volatility in the stock price.
- Volume: The volume indicators are relatively neutral, with a slight bearish bias indicated by the CMF.
Conclusion:
Based on the analysis of the technical indicators, the next few days' possible stock price movement for SFWL is likely to experience a short-term correction or consolidation. The overbought momentum signals, coupled with increased volatility and bearish volume pressure, suggest a potential pullback in the stock price. Investors should exercise caution and consider waiting for a better entry point before initiating new positions.