Technical Analysis of SBAC 2024-05-10
Overview:
In analyzing the technical indicators for SBAC over the last 5 days, we will delve into the trends, momentum, volatility, and volume indicators to provide a comprehensive outlook on the possible stock price movement in the coming days. By examining these key aspects, we aim to offer valuable insights and predictions for potential investors and traders.
Trend Indicators:
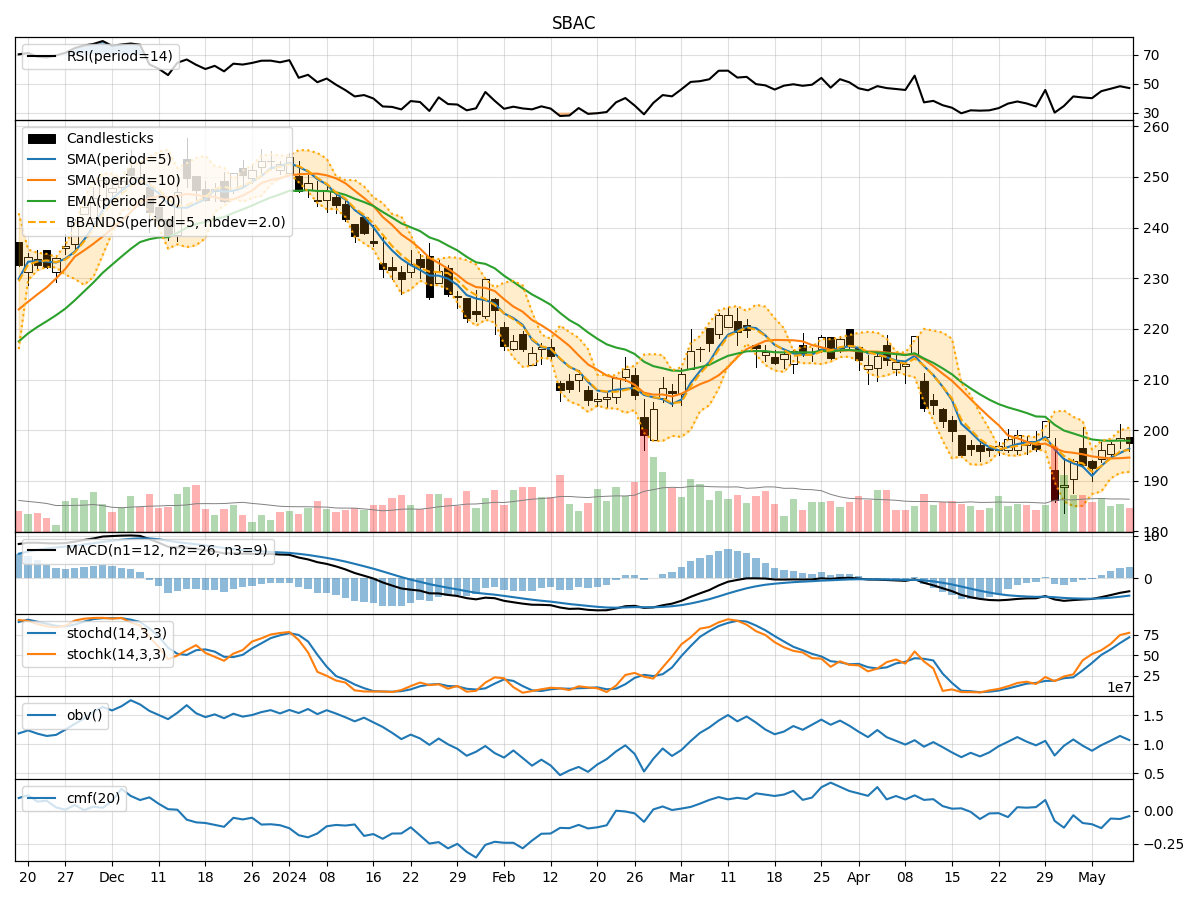
- Moving Averages (MA): The 5-day Moving Average (MA) has been consistently above the Simple Moving Average (SMA) and Exponential Moving Average (EMA), indicating a short-term uptrend.
- MACD: The Moving Average Convergence Divergence (MACD) has shown a decreasing trend in the MACD line compared to the Signal line, suggesting a potential reversal or consolidation.
- MACD Histogram: The MACD Histogram has been decreasing, indicating a weakening bullish momentum.
Momentum Indicators:
- RSI: The Relative Strength Index (RSI) has been fluctuating around the neutral zone, indicating indecision in the market.
- Stochastic Oscillator: Both %K and %D lines of the Stochastic Oscillator have been in the overbought zone, suggesting a potential reversal or pullback.
- Williams %R: The Williams %R is in the oversold territory, indicating a possible buying opportunity.
Volatility Indicators:
- Bollinger Bands: The Bollinger Bands have been narrowing, suggesting a decrease in volatility and a potential period of consolidation.
- Bollinger %B: The %B indicator is below 1, indicating that the price is trading below the lower Bollinger Band, signaling a possible oversold condition.
Volume Indicators:
- On-Balance Volume (OBV): The OBV has shown a mixed trend, indicating uncertainty in the accumulation/distribution of the stock.
- Chaikin Money Flow (CMF): The CMF has been negative, suggesting a lack of buying pressure in the market.
Key Observations and Opinions:
- Trend: The trend indicators suggest a short-term uptrend, but the weakening MACD and narrowing Bollinger Bands indicate a potential reversal or consolidation.
- Momentum: The momentum indicators show mixed signals with RSI in the neutral zone, Stochastic in overbought territory, and Williams %R in oversold territory, indicating a lack of clear direction.
- Volatility: The decreasing volatility indicated by the Bollinger Bands narrowing suggests a period of consolidation or a potential breakout.
- Volume: The volume indicators reflect uncertainty in the market sentiment, with OBV showing mixed signals and CMF indicating a lack of strong buying pressure.
Conclusion:
Based on the analysis of the technical indicators, the stock price of SBAC is likely to experience sideways movement in the coming days. The conflicting signals from the trend, momentum, volatility, and volume indicators suggest a period of consolidation or indecision among market participants. Traders and investors should exercise caution and wait for clearer signals before making significant trading decisions.