Technical Analysis of SATL 2024-05-10
Overview:
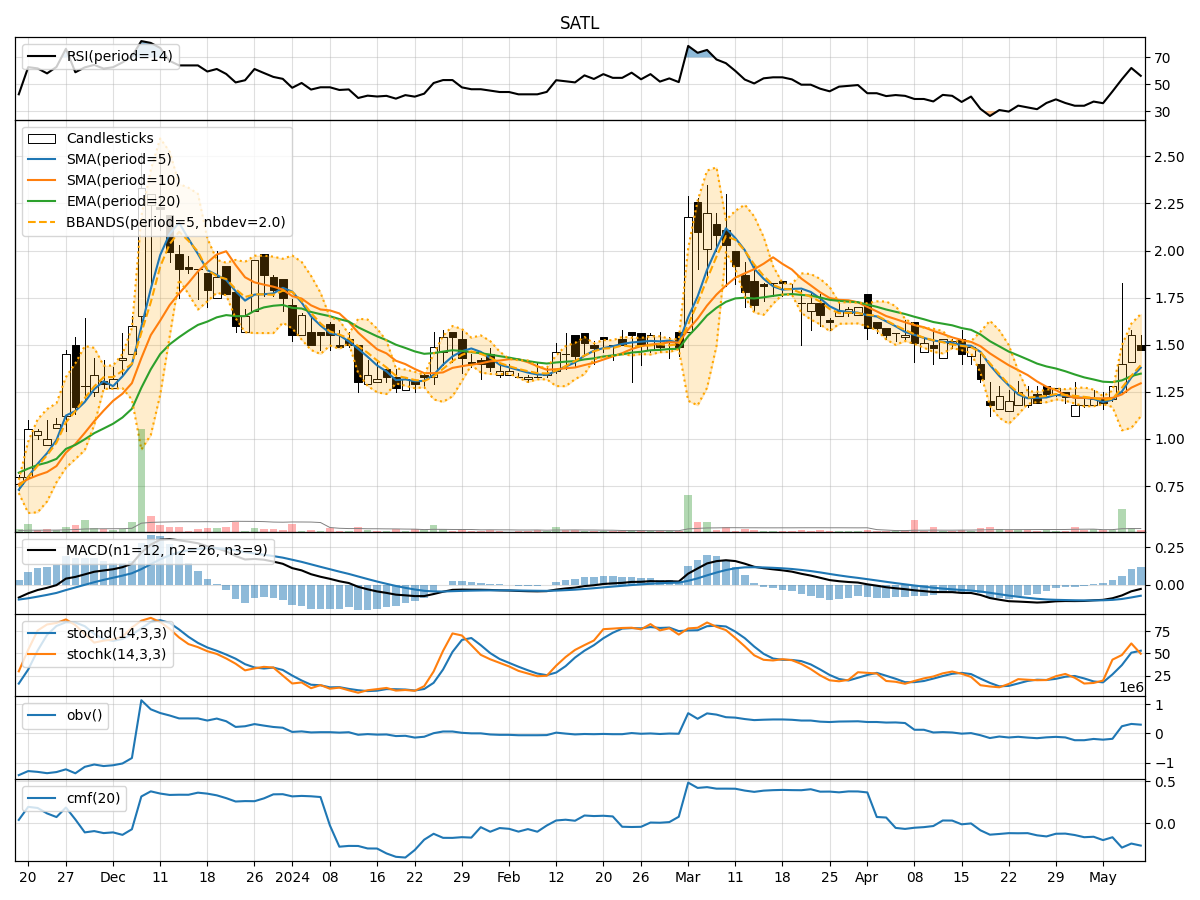
In the last 5 trading days, SATL stock has shown mixed movements in terms of price and volume. The trend indicators suggest a slight bearish sentiment, with the Moving Average Convergence Divergence (MACD) showing negative values. Momentum indicators indicate a neutral to slightly bullish sentiment, with the Relative Strength Index (RSI) trending upwards. Volatility indicators show an increasing Bollinger Bands width, indicating potential price expansion. Volume indicators suggest a mix of buying and selling pressure.
Trend Analysis:
- Moving Averages (MA): The 5-day Moving Average (MA) is below the Simple Moving Average (SMA) and Exponential Moving Average (EMA), indicating a short-term bearish trend.
- MACD: The MACD line is below the signal line, indicating a bearish trend.
- MACD Histogram: The MACD Histogram is negative, suggesting a bearish momentum.
Momentum Analysis:
- RSI: The RSI is trending upwards, indicating a potential bullish momentum.
- Stochastic Oscillator: The Stochastic Oscillator is in the neutral zone, suggesting a lack of clear direction.
- Williams %R: The Williams %R is below -50, indicating a potential oversold condition.
Volatility Analysis:
- Bollinger Bands (BB): The Bollinger Bands are widening, suggesting increasing volatility and potential price expansion.
Volume Analysis:
- On-Balance Volume (OBV): The OBV is mixed, indicating both buying and selling pressure.
- Chaikin Money Flow (CMF): The CMF is negative, suggesting a bearish money flow.
Key Observations:
- The trend indicators show a bearish sentiment in the short term.
- Momentum indicators suggest a potential bullish momentum building up.
- Volatility indicators point towards increasing price volatility.
- Volume indicators indicate a mix of buying and selling pressure.
Conclusion:
Based on the analysis of the technical indicators, the next few days for SATL stock could see mixed movements with a slight bearish bias in the short term. However, the momentum indicators hint at a potential bullish momentum developing. The increasing volatility could lead to price expansion. It is essential to monitor the price action closely for any signs of a reversal or confirmation of the bullish momentum. Exercise caution and consider setting appropriate stop-loss levels to manage risk effectively.