Technical Analysis of RVSN 2024-05-10
Overview:
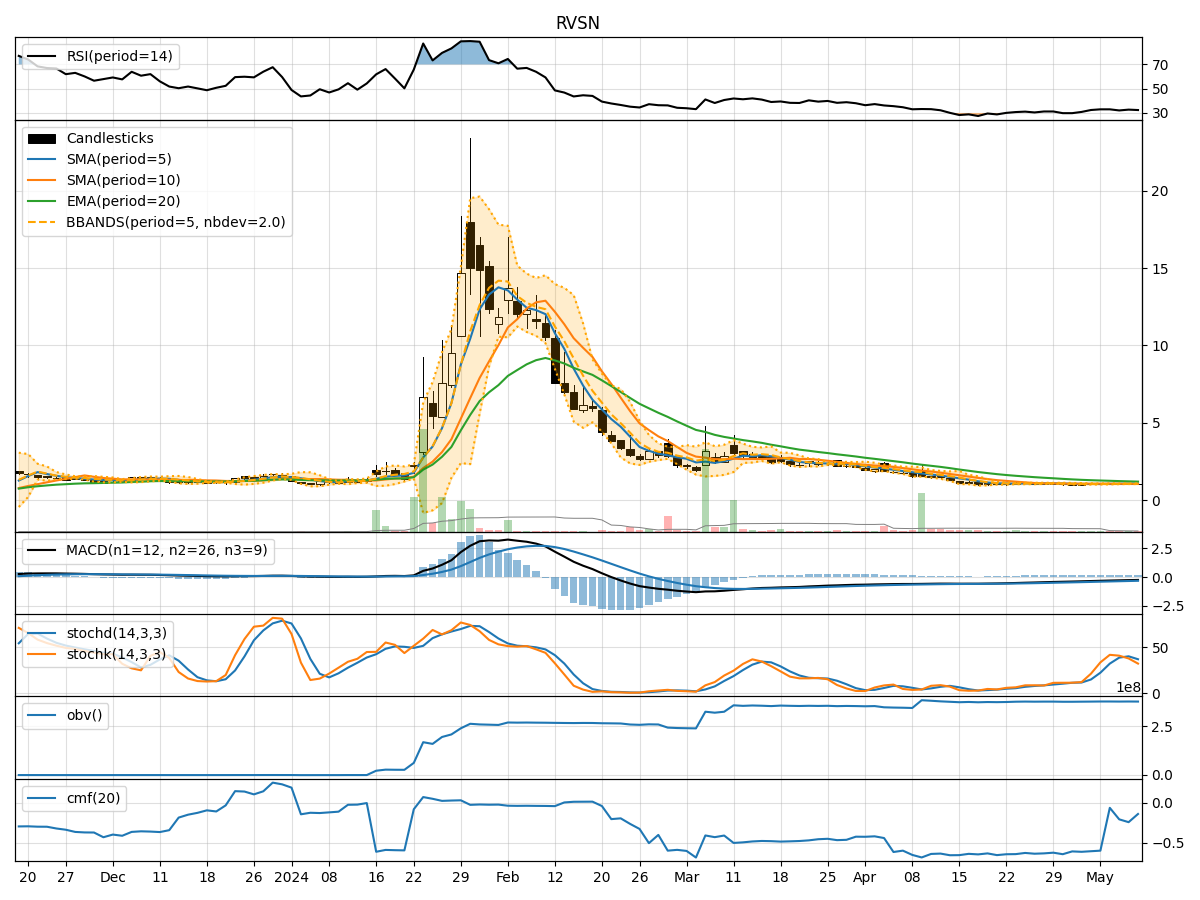
In analyzing the technical indicators for RVSN over the last 5 days, we will delve into the trend, momentum, volatility, and volume indicators to provide a comprehensive outlook on the possible stock price movement in the coming days. By examining these key indicators, we aim to offer valuable insights and predictions for informed decision-making.
Trend Analysis:
- Moving Averages (MA): The 5-day MA has been fluctuating around the stock price, indicating a lack of clear trend direction.
- MACD: The MACD line has been consistently negative, suggesting a bearish momentum in the short term.
- EMA: The EMA has been declining, reflecting a downward trend in the stock price.
Key Observation: The trend indicators point towards a bearish sentiment in the stock price movement.
Momentum Analysis:
- RSI: The RSI values have been relatively low, indicating oversold conditions but not showing a clear reversal signal.
- Stochastic Oscillator: Both %K and %D have been trending downwards, signaling weakening momentum.
- Williams %R: The indicator has been in the oversold territory, suggesting a potential reversal, but confirmation is needed.
Key Observation: Momentum indicators suggest a bearish momentum in the stock.
Volatility Analysis:
- Bollinger Bands: The bands have been narrowing, indicating decreasing volatility in the stock price.
- Bollinger %B: The %B values have been decreasing, showing the price moving towards the lower band.
Key Observation: Volatility indicators point towards a decreasing volatility in the stock price.
Volume Analysis:
- On-Balance Volume (OBV): The OBV has been fluctuating, not showing a clear trend in volume accumulation.
- Chaikin Money Flow (CMF): The CMF has been negative, indicating selling pressure in the stock.
Key Observation: Volume indicators suggest mixed signals with no clear trend in volume accumulation.
Conclusion:
Based on the analysis of trend, momentum, volatility, and volume indicators, the overall outlook for RVSN in the next few days is bearish. The trend indicators, momentum oscillators, and volume analysis all point towards a continued downward movement in the stock price. The decreasing volatility further supports the likelihood of a bearish trend continuation.
Recommendation: Considering the bearish signals across multiple technical indicators, it is advisable to exercise caution or consider short-term selling strategies for RVSN in the upcoming trading sessions.