Technical Analysis of ROOT 2024-05-10
Overview:
In analyzing the technical indicators for ROOT stock over the last 5 days, we will delve into the trend, momentum, volatility, and volume indicators to provide a comprehensive outlook on the possible stock price movement in the coming days. By examining these key indicators, we aim to offer valuable insights and predictions for informed decision-making.
Trend Analysis:
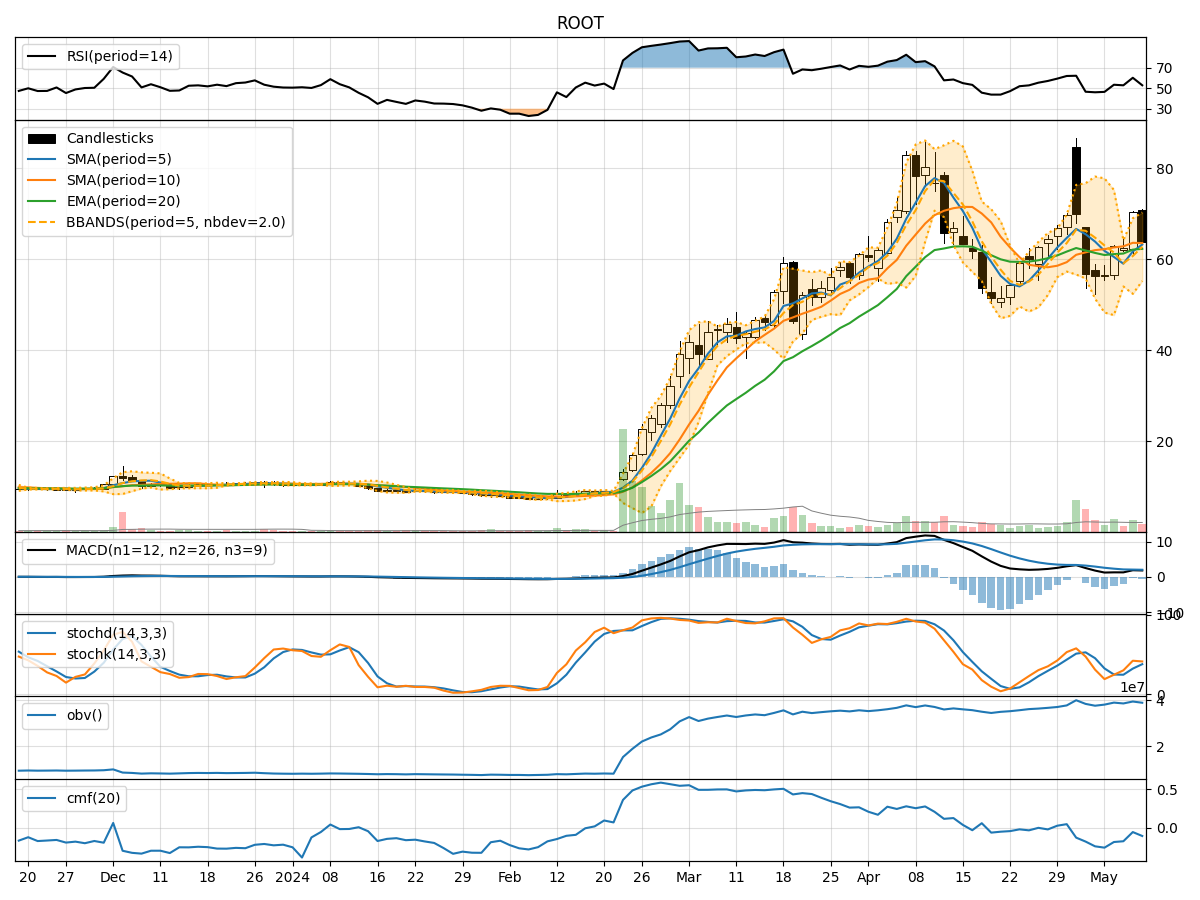
- Moving Averages (MA): The 5-day Moving Average (MA) has been fluctuating around the Simple Moving Average (SMA) and Exponential Moving Average (EMA) values, indicating a lack of clear trend direction.
- MACD: The Moving Average Convergence Divergence (MACD) has shown some positive values, suggesting a potential bullish momentum.
- Conclusion: The trend indicators are mixed, with no strong directional bias evident.
Momentum Analysis:
- RSI: The Relative Strength Index (RSI) has been hovering around the mid-range, indicating a neutral momentum.
- Stochastic Oscillator: Both %K and %D values have shown fluctuations but are not in extreme overbought or oversold territories.
- Conclusion: Momentum indicators suggest a lack of strong momentum in either direction.
Volatility Analysis:
- Bollinger Bands (BB): The Bollinger Bands have shown widening and narrowing patterns, reflecting fluctuations in volatility.
- Conclusion: Volatility has been fluctuating, indicating potential price swings in the near term.
Volume Analysis:
- On-Balance Volume (OBV): The OBV has shown mixed movements, indicating indecision among market participants.
- Chaikin Money Flow (CMF): The CMF has been negative, suggesting selling pressure in the stock.
- Conclusion: Volume indicators point towards uncertainty and a lack of clear direction.
Key Observations:
- The trend indicators do not show a clear trend, indicating a sideways or consolidating market.
- Momentum indicators suggest a neutral stance with no strong buying or selling pressure.
- Volatility has been fluctuating, signaling potential price swings.
- Volume indicators reflect indecision and selling pressure in the market.
Conclusion:
Based on the analysis of the technical indicators, the next few days for ROOT stock are likely to see sideways movement with increased volatility. The lack of a clear trend direction, neutral momentum, fluctuating volatility, and uncertain volume patterns suggest a period of consolidation or indecision among market participants. Traders and investors should exercise caution and closely monitor price movements for potential breakout or breakdown scenarios.