Technical Analysis of RMBS 2024-05-31
Overview:
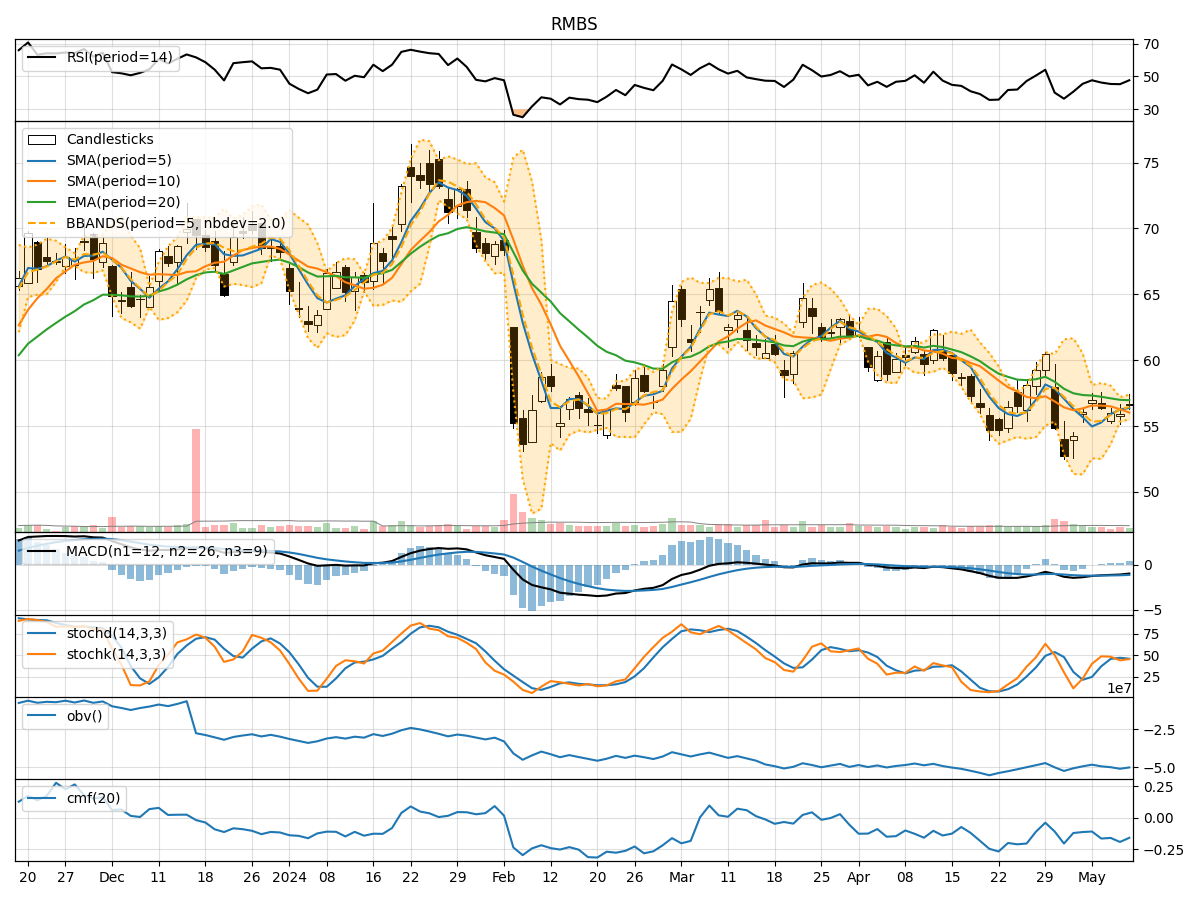
In analyzing the technical indicators for RMBS over the last 5 days, we will delve into the trend, momentum, volatility, and volume indicators to provide a comprehensive outlook on the possible stock price movement in the coming days.
Trend Analysis:
- Moving Averages (MA): The 5-day MA has been consistently below the closing prices, indicating a short-term downtrend.
- MACD: The MACD line has been decreasing, with the MACD histogram also showing a downward trend, suggesting a bearish momentum.
Momentum Analysis:
- RSI: The RSI values have been relatively low, indicating a lack of strong momentum in either direction.
- Stochastic Oscillator: Both %K and %D values have been low, reflecting a potential oversold condition.
Volatility Analysis:
- Bollinger Bands (BB): The stock price has been trading below the lower Bollinger Band, indicating oversold conditions.
Volume Analysis:
- On-Balance Volume (OBV): The OBV has been fluctuating, suggesting indecision among investors.
- Chaikin Money Flow (CMF): The CMF has been negative, indicating selling pressure in the stock.
Key Observations:
- The stock is currently in a downtrend based on moving averages and MACD.
- Momentum indicators suggest a lack of strong momentum in either direction.
- Volatility indicators point towards an oversold condition based on Bollinger Bands.
- Volume indicators show indecisiveness among investors with selling pressure.
Conclusion:
Based on the technical analysis of RMBS, the stock is likely to experience further downside movement in the coming days. The indicators collectively suggest a bearish outlook, with potential for the stock price to continue its downward trend. Traders and investors should exercise caution and consider waiting for more positive signals before considering any long positions.