Technical Analysis of RGC 2024-05-10
Overview:
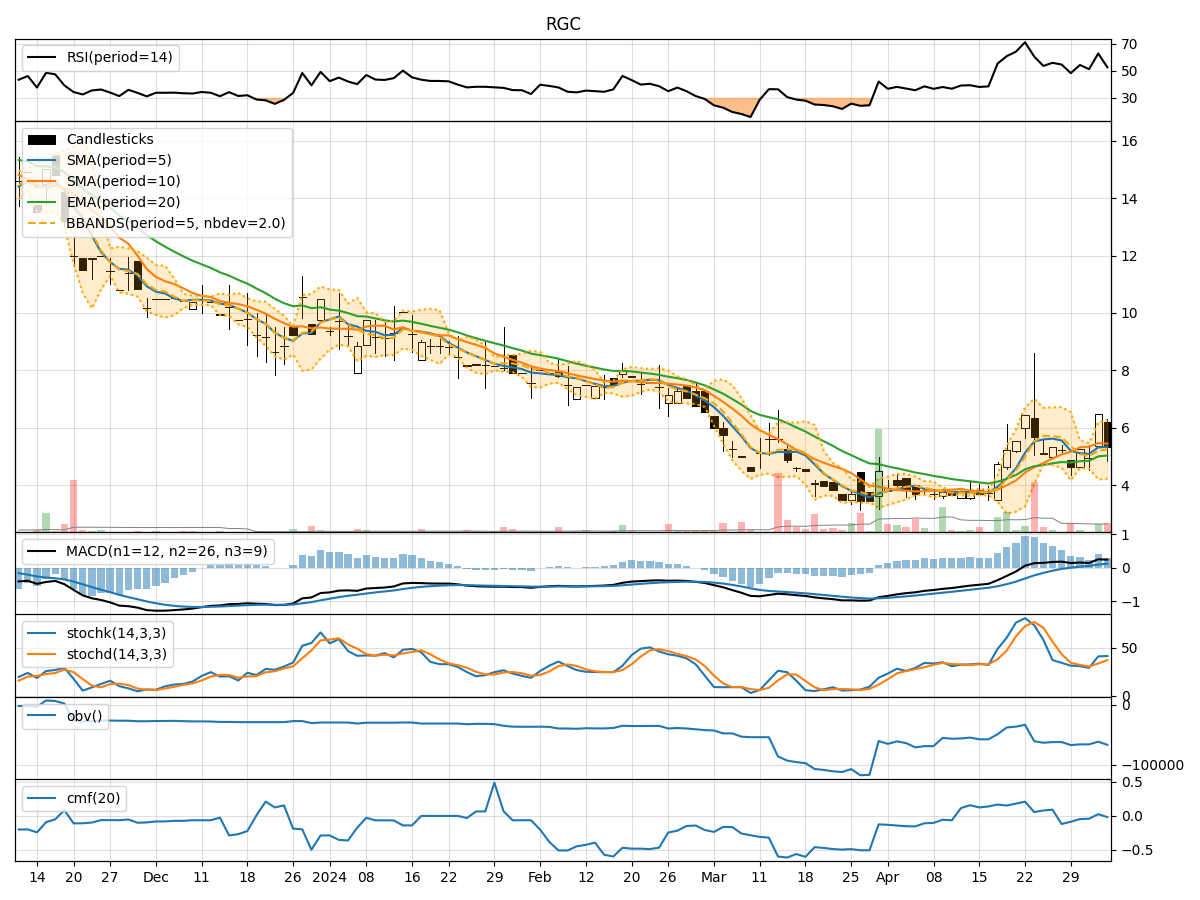
In analyzing the technical indicators for RGC over the last 5 days, we will delve into the trend, momentum, volatility, and volume indicators to provide a comprehensive outlook on the possible stock price movement in the coming days. By examining these key aspects, we aim to offer valuable insights and recommendations for potential investors.
Trend Analysis:
- Moving Averages (MA): The 5-day Moving Average (MA) has been fluctuating around the closing prices, indicating short-term price trends. The Simple Moving Average (SMA) and Exponential Moving Average (EMA) have shown an upward trend, suggesting a bullish momentum.
- MACD: The Moving Average Convergence Divergence (MACD) has been positive and increasing, indicating a strengthening bullish trend.
Momentum Analysis:
- RSI: The Relative Strength Index (RSI) has been hovering around the neutral zone, suggesting a balanced momentum without extreme overbought or oversold conditions.
- Stochastic Oscillator: Both %K and %D have been fluctuating, indicating a lack of clear momentum direction.
Volatility Analysis:
- Bollinger Bands (BB): The Bollinger Bands have shown narrowing volatility, with the bands converging, indicating a potential decrease in price volatility.
Volume Analysis:
- On-Balance Volume (OBV): The OBV has been fluctuating, indicating mixed buying and selling pressure.
- Chaikin Money Flow (CMF): The CMF has been negative, suggesting a slight distribution phase.
Key Observations:
- The trend indicators suggest a bullish sentiment with moving averages and MACD pointing towards an upward trend.
- Momentum indicators show a lack of clear direction, indicating a potential consolidation phase.
- Volatility is decreasing, which may lead to a period of price stabilization.
- Volume indicators reflect mixed sentiment with fluctuating OBV and negative CMF.
Conclusion:
Based on the analysis of the technical indicators, the stock price of RGC is likely to experience sideways movement in the coming days. The bullish trend indicated by moving averages and MACD may be offset by the lack of clear momentum direction and decreasing volatility. Investors should exercise caution and closely monitor the price action for potential entry or exit points.