Technical Analysis of REGN 2024-05-10
Overview:
In analyzing the technical indicators for REGN over the last 5 days, we will delve into the trend, momentum, volatility, and volume indicators to provide a comprehensive outlook on the possible stock price movement. By examining these key aspects, we aim to offer valuable insights and predictions for the upcoming days.
Trend Indicators:
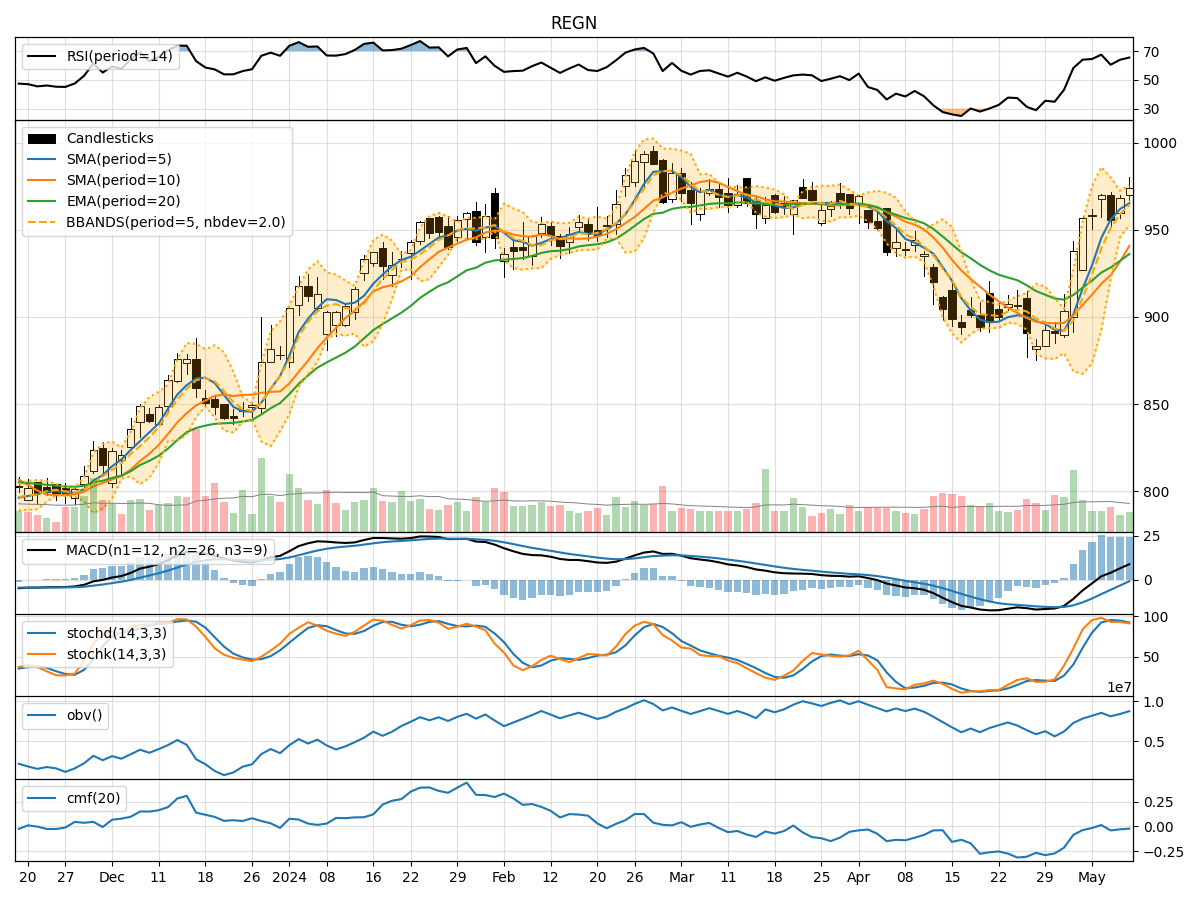
- Moving Averages (MA): The 5-day moving average has been consistently above the longer-term simple moving average (SMA) and exponential moving average (EMA), indicating a bullish trend.
- MACD: The MACD line has been consistently above the signal line, suggesting bullish momentum.
- MACD Histogram: The MACD histogram has been gradually decreasing but remains in positive territory, indicating a potential slowdown in bullish momentum.
Momentum Indicators:
- RSI: The Relative Strength Index (RSI) has been fluctuating in the overbought territory, indicating strong buying pressure.
- Stochastic Oscillator: Both %K and %D lines have been relatively high, suggesting an overbought condition.
- Williams %R: The Williams %R is consistently in the oversold region, indicating a potential reversal in price.
Volatility Indicators:
- Bollinger Bands: The stock price has been trading within the upper Bollinger Band, indicating an overbought condition.
- Bollinger Band Width: The Band Width has been narrowing, suggesting a potential decrease in volatility.
- Bollinger Band %B: The %B indicator has been above 0.8, indicating a high price relative to the upper band.
Volume Indicators:
- On-Balance Volume (OBV): The OBV has shown mixed signals, with fluctuations in volume accumulation.
- Chaikin Money Flow (CMF): The CMF has been negative, indicating selling pressure in the market.
Key Observations:
- The trend indicators suggest a strong bullish sentiment in the short term.
- Momentum indicators indicate potential overbought conditions, signaling a possible reversal.
- Volatility indicators point towards a decrease in volatility and a potential consolidation phase.
- Volume indicators show mixed signals, with no clear direction in volume accumulation.
Conclusion:
Based on the analysis of the technical indicators, the next few days for REGN could see a potential consolidation phase with a slight downward bias. Traders should exercise caution as the stock may experience a pullback from overbought levels. It is advisable to wait for confirmation signals before making any significant trading decisions.