Technical Analysis of RAYA 2024-05-10
Overview:
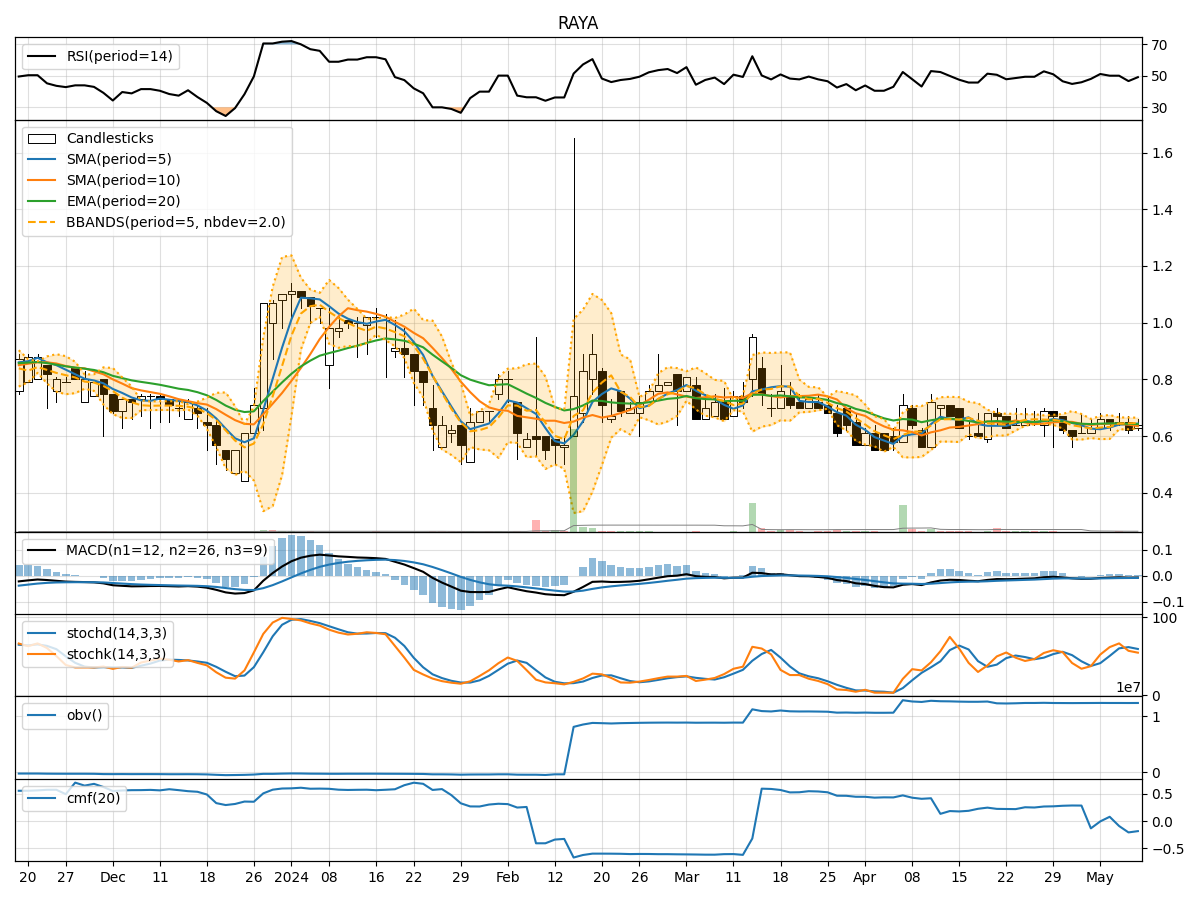
In analyzing the technical indicators for RAYA stock over the last 5 days, we will delve into the trends, momentum, volatility, and volume aspects to provide a comprehensive outlook on the possible future stock price movement. By examining key indicators such as moving averages, MACD, RSI, Bollinger Bands, and OBV, we aim to offer valuable insights and predictions for the upcoming trading days.
Trend Analysis:
- Moving Averages (MA): The 5-day moving average has been showing a slight uptrend, indicating a short-term positive momentum in the stock price.
- MACD: The MACD line has been consistently below the signal line, suggesting a bearish trend in the stock price.
- EMA: The exponential moving average has been relatively stable, reflecting a neutral to slightly bearish sentiment in the market.
Key Observation: The moving averages suggest a mixed outlook with a slight bullish bias in the short term.
Momentum Analysis:
- RSI: The Relative Strength Index has been fluctuating around the 50 level, indicating a lack of strong momentum in either direction.
- Stochastic Oscillator: Both %K and %D have been hovering around the mid-range, signaling a neutral stance in momentum.
- Williams %R: The Williams %R is also oscillating near the oversold territory, suggesting a potential reversal in the stock price.
Key Observation: Momentum indicators point towards a neutral stance with a potential for a reversal in the near future.
Volatility Analysis:
- Bollinger Bands: The Bollinger Bands have been narrowing, indicating decreasing volatility in the stock price.
- Bollinger %B: The %B indicator has been fluctuating within a tight range, reflecting a period of consolidation.
- Bollinger Band Width: The band width has been contracting, suggesting a potential breakout or significant price movement ahead.
Key Observation: Volatility indicators signal a period of consolidation and a potential breakout in the stock price.
Volume Analysis:
- On-Balance Volume (OBV): The OBV has been relatively flat, indicating a balance between buying and selling pressure.
- Chaikin Money Flow (CMF): The CMF has been negative, suggesting a net outflow of money from the stock.
Key Observation: Volume indicators point towards a lack of significant buying interest and a slight bearish sentiment in the market.
Conclusion:
Based on the analysis of the technical indicators, the next few days for RAYA stock are likely to see sideways movement with a potential for a bullish breakout. The trend indicators suggest a mixed outlook with a slight bullish bias, while momentum indicators indicate a neutral stance with a possibility of a reversal. Volatility indicators point towards a period of consolidation, potentially leading to a breakout, and volume indicators reflect a lack of strong buying interest.
Overall, the stock is likely to consolidate in the short term before potentially experiencing a bullish breakout. Traders should closely monitor key resistance and support levels for confirmation of the anticipated price movement.