Technical Analysis of RARE 2024-05-31
Overview:
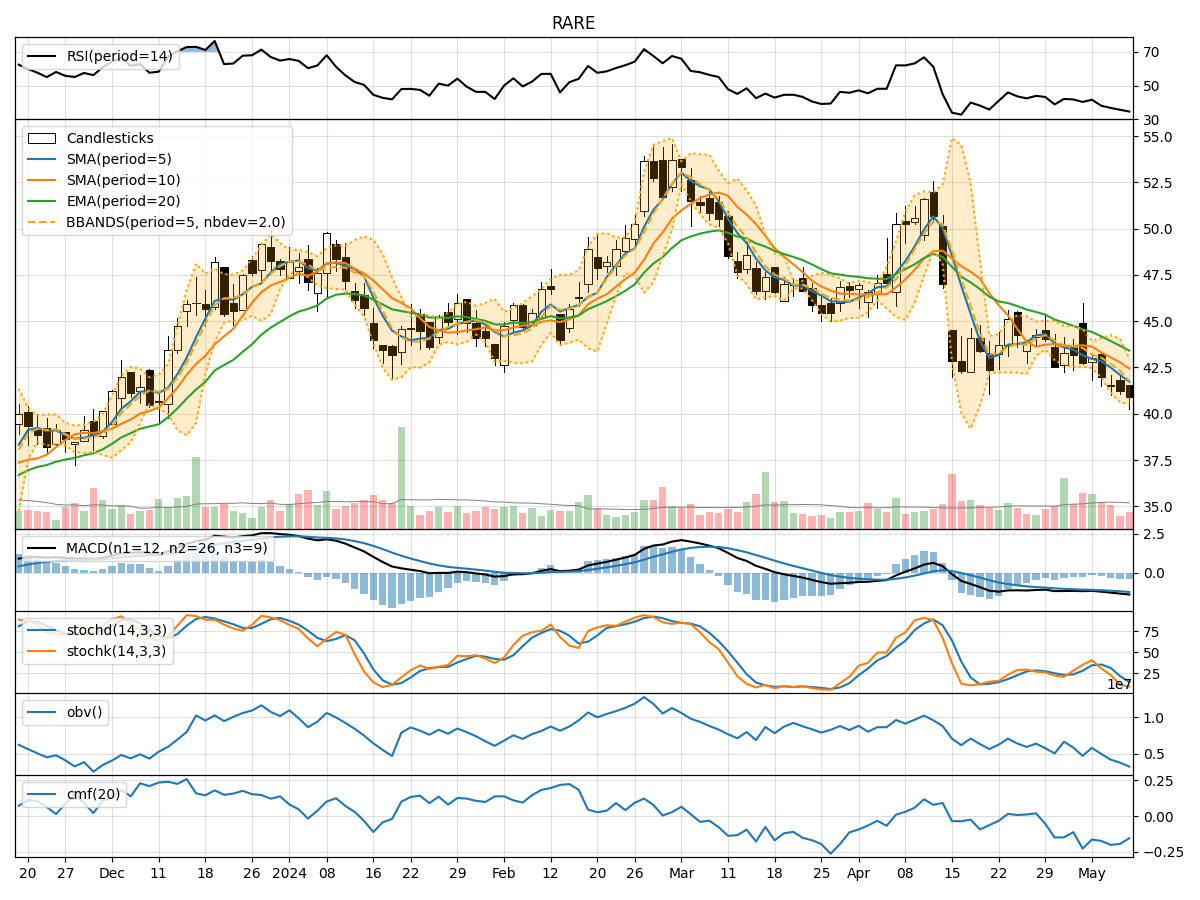
In analyzing the technical indicators for RARE over the last 5 days, we will delve into the trend, momentum, volatility, and volume indicators to provide a comprehensive outlook on the possible stock price movement in the coming days. By examining these key aspects, we aim to offer valuable insights and predictions for potential investors.
Trend Indicators:
- Moving Averages (MA): The 5-day MA has been consistently below the closing prices, indicating a short-term downtrend.
- MACD: The MACD line has been negative, suggesting bearish momentum in the stock.
- EMA: The exponential moving average has been declining, further supporting the bearish trend.
Momentum Indicators:
- RSI: The RSI has been relatively low, indicating oversold conditions in the stock.
- Stochastic Oscillator: Both %K and %D have been trending lower, signaling weakening momentum.
- Williams %R: The indicator has been in oversold territory, suggesting a potential reversal.
Volatility Indicators:
- Bollinger Bands: The stock price has been consistently below the middle Bollinger Band, indicating a downtrend.
- Bollinger %B: The %B has been below 0.5, suggesting the stock is trading at the lower end of its recent price range.
Volume Indicators:
- On-Balance Volume (OBV): The OBV has been declining, indicating selling pressure in the stock.
- Chaikin Money Flow (CMF): The CMF has been negative, reflecting a lack of buying interest.
Key Observations:
- The stock is currently in a downtrend based on the moving averages and MACD.
- Momentum indicators suggest the stock is oversold and may see a potential reversal.
- Volatility indicators point towards a bearish sentiment with the stock trading at the lower end of its range.
- Volume indicators indicate selling pressure and a lack of buying interest in the stock.
Conclusion:
Based on the analysis of the technical indicators, the next few days for RARE are likely to see further downside movement in the stock price. The overall trend remains bearish, supported by momentum, volatility, and volume indicators. Investors should exercise caution and consider waiting for confirmation of a reversal before considering any long positions. The stock is currently in a downtrend and may continue to face selling pressure in the near term.