Technical Analysis of QURE 2024-05-10
Overview:
In analyzing the technical indicators for QURE over the last 5 days, we will delve into the trend, momentum, volatility, and volume indicators to provide a comprehensive outlook on the possible stock price movement in the coming days. By examining these key aspects, we aim to offer valuable insights and predictions to guide your investment decisions.
Trend Analysis:
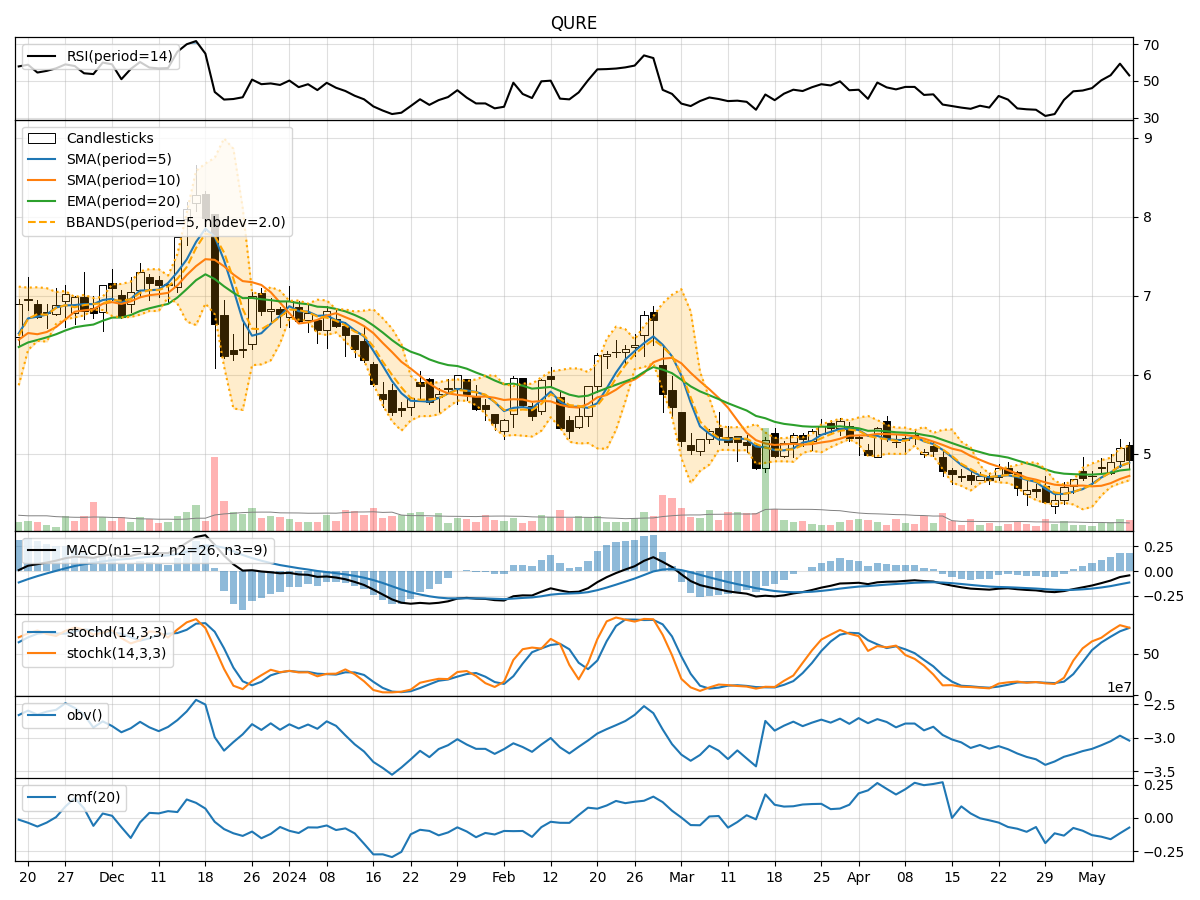
- Moving Averages (MA): The 5-day Moving Average (MA) has been trending above the Simple Moving Average (SMA) and Exponential Moving Average (EMA), indicating a short-term bullish trend.
- MACD: The Moving Average Convergence Divergence (MACD) has been negative but showing signs of convergence, suggesting a potential reversal in the downtrend.
- Conclusion: The trend indicators point towards a potential reversal to an upward trend in the coming days.
Momentum Analysis:
- RSI: The Relative Strength Index (RSI) has been fluctuating around the neutral zone, indicating indecision in the market.
- Stochastic Oscillator: Both %K and %D have been in the overbought territory, signaling a potential reversal or consolidation.
- Conclusion: The momentum indicators suggest a mixed sentiment with a possibility of consolidation in the near term.
Volatility Analysis:
- Bollinger Bands (BB): The stock price has been trading within the Bollinger Bands, with the bands narrowing, indicating decreasing volatility.
- Conclusion: Volatility is decreasing, which could lead to a period of consolidation or a potential breakout in the near future.
Volume Analysis:
- On-Balance Volume (OBV): The OBV has been fluctuating, indicating mixed buying and selling pressure.
- Chaikin Money Flow (CMF): The CMF has been negative, suggesting a lack of buying interest.
- Conclusion: Volume indicators reflect uncertainty in the market sentiment, with no clear direction indicated.
Overall Conclusion:
Based on the analysis of trend, momentum, volatility, and volume indicators, the stock price of QURE is likely to experience sideways movement or consolidation in the next few days. The trend indicators suggest a potential reversal to an upward trend, while momentum and volume indicators point towards mixed sentiment and uncertainty in the market. Therefore, it is advisable to exercise caution and closely monitor the price action for any potential breakout or trend confirmation before making any significant trading decisions.
Key Takeaways:
- Trend: Potential reversal to an upward trend.
- Momentum: Mixed sentiment with a possibility of consolidation.
- Volatility: Decreasing volatility may lead to consolidation or breakout.
- Volume: Uncertainty in market sentiment, no clear direction indicated.
In conclusion, a cautious approach is recommended, considering the mixed signals from the technical indicators. Stay vigilant and be prepared to adapt your trading strategy based on the evolving market dynamics.