Technical Analysis of PSNYW 2024-05-10
Overview:
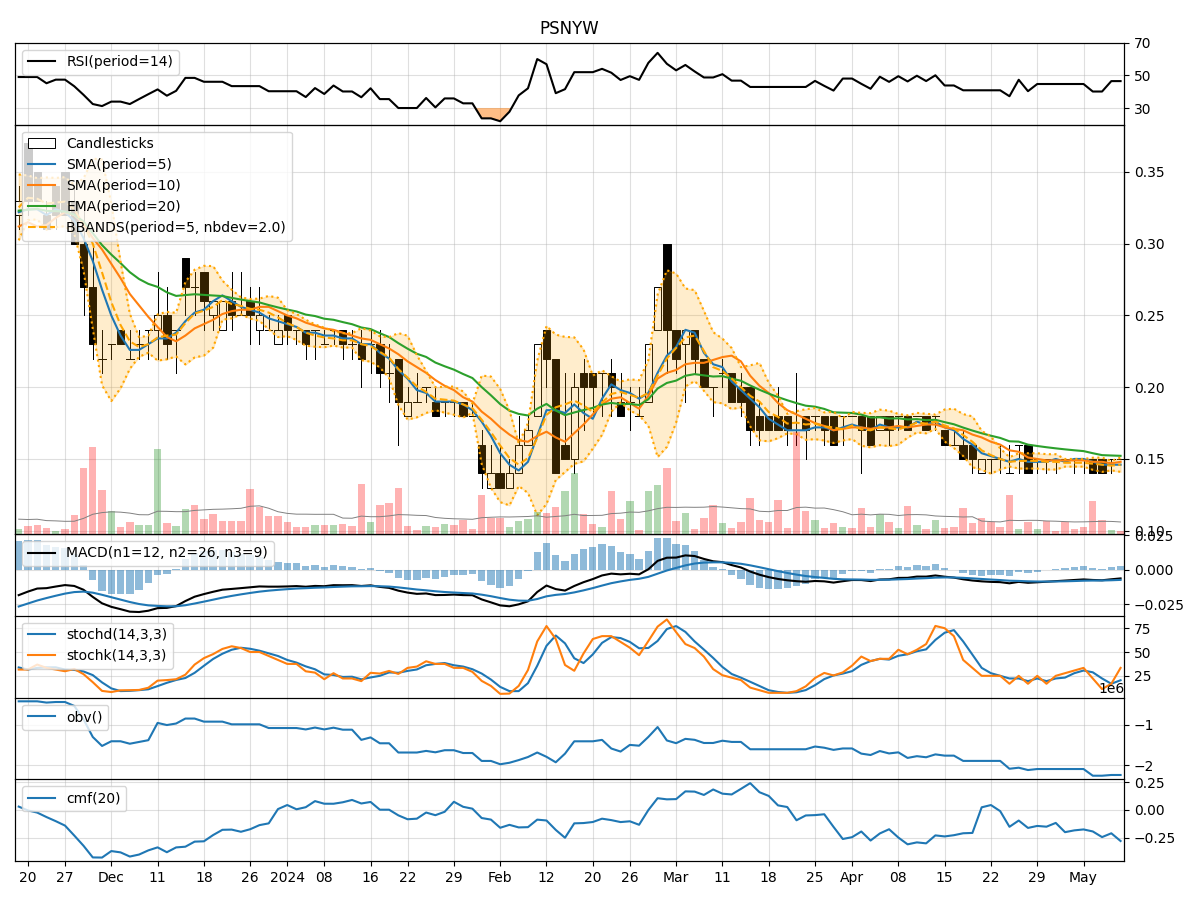
In the last 5 trading days, PSNYW stock has shown a consistent closing price around $0.15 with varying trading volumes. The trend indicators suggest a slight downward trend, with moving averages and MACD showing negative values. Momentum indicators indicate a mixed sentiment, with RSI hovering around 40-50. Volatility indicators show a narrowing Bollinger Band, indicating decreasing price volatility. Volume indicators suggest a negative trend in On-Balance Volume (OBV) and Chaikin Money Flow (CMF).
Trend Analysis:
- Moving Averages (MA): The 5-day MA is close to the closing price, indicating a short-term trend. However, the SMA(10) and EMA(20) are slightly above the closing price, suggesting a downward trend.
- MACD: The MACD line is negative, indicating a bearish trend. The MACD Histogram is decreasing, showing weakening bearish momentum.
Momentum Analysis:
- RSI: The RSI is around 40-50, indicating a neutral sentiment without clear overbought or oversold conditions.
- Stochastic Oscillator: The Stochastic indicators are fluctuating but not in extreme territories, suggesting a lack of strong momentum.
Volatility Analysis:
- Bollinger Bands (BB): The Bollinger Bands are narrowing, indicating decreasing price volatility and a potential upcoming breakout.
- Bollinger Band %B (BBP): The %B is close to 1, suggesting the price is at the upper band, potentially indicating an overbought condition.
Volume Analysis:
- On-Balance Volume (OBV): The OBV is negative, indicating selling pressure and a potential bearish sentiment.
- Chaikin Money Flow (CMF): The CMF is also negative, suggesting a lack of buying interest and potential weakness in the stock.
Conclusion:
Based on the technical indicators and analysis: - Trend: The trend indicators show a slight downward bias. - Momentum: Momentum indicators are mixed, indicating a lack of strong directional momentum. - Volatility: Decreasing volatility suggests a potential period of consolidation before a breakout. - Volume: Negative OBV and CMF indicate selling pressure and weak buying interest.
Overall Assessment:
Considering the current technical picture, the stock is likely to experience sideways consolidation in the near term. Traders should watch for a breakout above the upper Bollinger Band or a breakdown below the lower band for potential entry points. The lack of strong momentum and negative volume indicators suggest a cautious approach, with a neutral to slightly bearish bias until clearer signals emerge.