Technical Analysis of PRTA 2024-05-10
Overview:
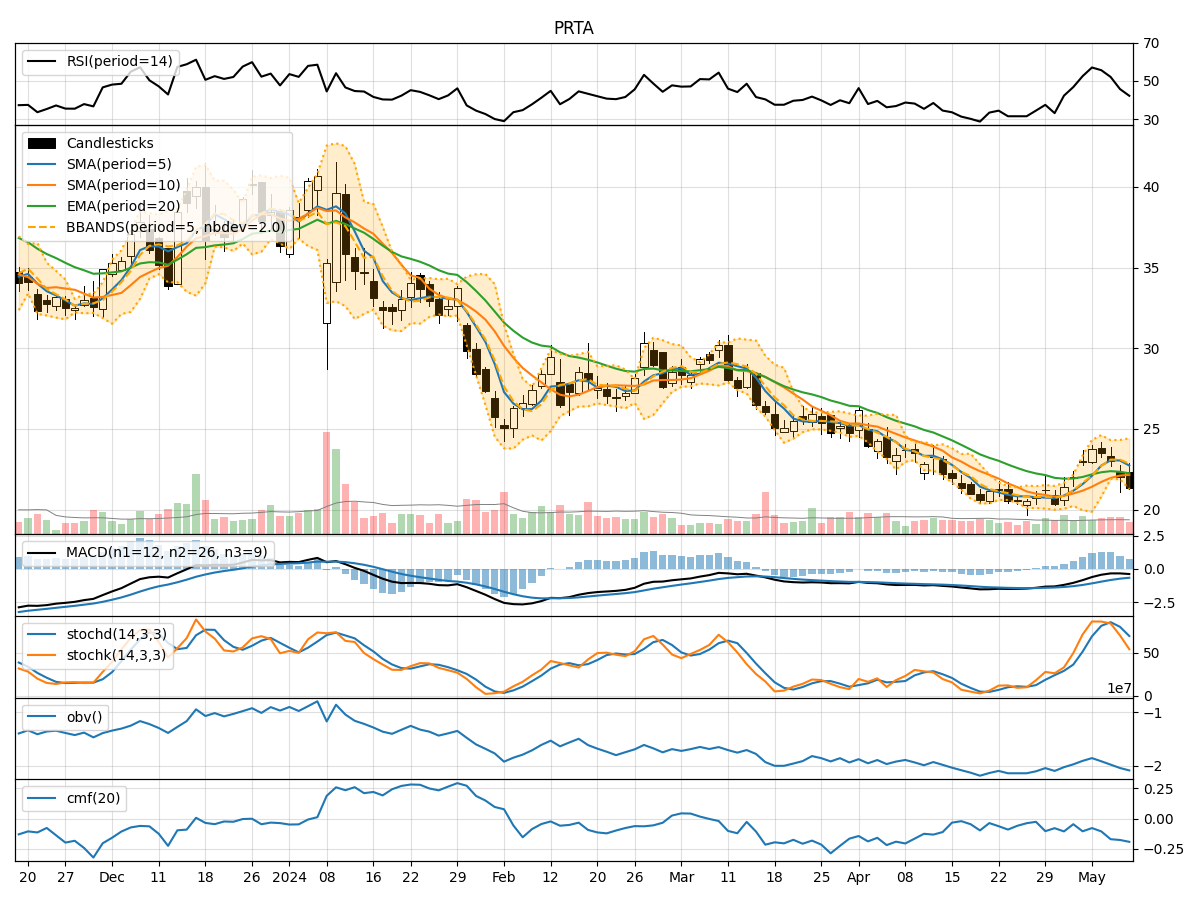
In analyzing the technical indicators for PRTA over the last 5 days, we will delve into the trend, momentum, volatility, and volume indicators to provide a comprehensive outlook on the possible stock price movement in the coming days.
Trend Analysis:
- Moving Averages (MA): The 5-day Moving Average (MA) has been declining, indicating a short-term bearish trend.
- MACD: The MACD line has been consistently below the signal line, suggesting a bearish momentum.
- Relative Strength Index (RSI): The RSI has been decreasing, reflecting weakening buying pressure.
Momentum Analysis:
- Stochastic Oscillator: Both %K and %D have been declining, signaling a bearish momentum.
- Williams %R (WillR): The WillR indicator has been in oversold territory, indicating a potential reversal.
Volatility Analysis:
- Bollinger Bands (BB): The stock price has been trading below the lower Bollinger Band, indicating oversold conditions.
- Bollinger Band Width (BBW): The BBW has been narrowing, suggesting a decrease in volatility.
Volume Analysis:
- On-Balance Volume (OBV): The OBV has been consistently decreasing, indicating distribution.
- Chaikin Money Flow (CMF): The CMF has been negative, reflecting selling pressure.
Key Observations:
- The stock is currently in a downtrend based on moving averages and MACD.
- Momentum indicators like Stochastic Oscillator and RSI suggest a bearish sentiment.
- Volatility indicators show the stock is oversold and experiencing reduced volatility.
- Volume indicators indicate distribution and selling pressure.
Conclusion:
Based on the analysis of technical indicators, the next few days' possible stock price movement for PRTA is likely to be downward. The bearish trend, negative momentum, oversold conditions, and selling pressure indicated by various indicators point towards a continuation of the current downtrend. Traders and investors should exercise caution and consider shorting or staying on the sidelines until there are clear signs of a reversal in the technical indicators.