Technical Analysis of PROC 2024-05-10
Overview:
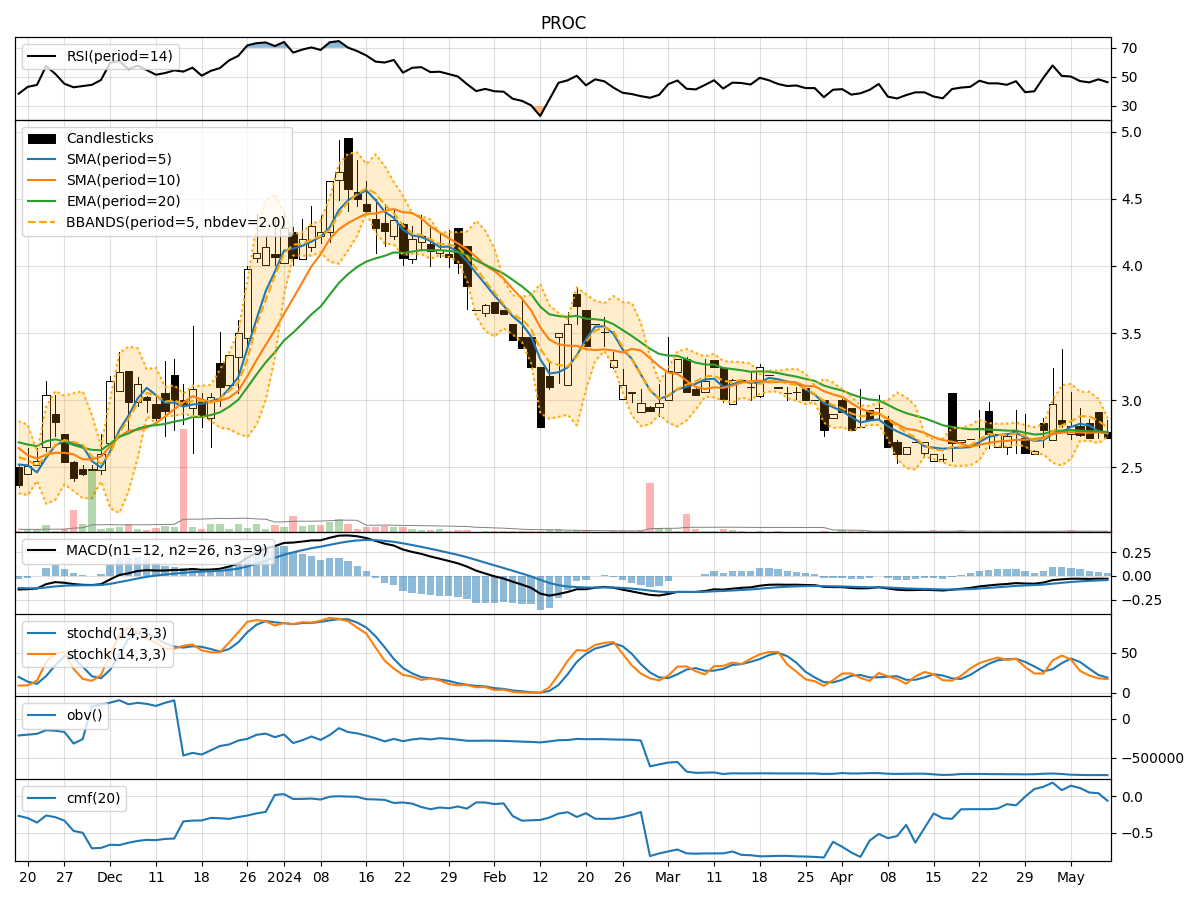
In the last 5 trading days, the stock has shown a mixed performance with fluctuations in price and volume. The trend indicators suggest a slightly bearish sentiment, while momentum indicators show a weakening trend. Volatility indicators indicate fluctuating price movements, and volume indicators show a slight decrease in buying pressure. Let's delve deeper into each category of indicators to provide a comprehensive analysis and make a prediction for the next few days.
Trend Indicators:
- Moving Averages (MA): The 5-day MA is below the closing price, indicating a short-term bearish trend.
- MACD: The MACD line is below the signal line, suggesting a bearish signal.
- MACD Histogram: The histogram is decreasing, indicating a weakening bullish momentum.
Key Observation: The trend indicators point towards a bearish sentiment in the short term.
Momentum Indicators:
- RSI: The RSI is below 50, indicating a bearish momentum.
- Stochastic Oscillator: Both %K and %D are in oversold territory, suggesting a bearish signal.
- Williams %R: The indicator is in oversold territory, indicating a bearish sentiment.
Key Observation: Momentum indicators support a bearish outlook for the stock.
Volatility Indicators:
- Bollinger Bands (BB): The price is currently trading within the bands, indicating normal volatility.
- Bollinger Band Width: The band width is relatively stable, suggesting consistent volatility levels.
Key Observation: Volatility indicators suggest stable price movements without any extreme fluctuations.
Volume Indicators:
- On-Balance Volume (OBV): The OBV is slightly decreasing, indicating a decrease in buying pressure.
- Chaikin Money Flow (CMF): The CMF is positive but decreasing, suggesting weakening buying pressure.
Key Observation: Volume indicators show a slight decrease in buying interest.
Conclusion:
Based on the analysis of trend, momentum, volatility, and volume indicators, the overall outlook for the stock in the next few days is bearish. The trend indicators, momentum indicators, and volume indicators all point towards a potential downward movement in the stock price. While volatility remains stable, the weakening momentum and bearish sentiment from various indicators suggest a high probability of a downward trend.
Recommendation: Considering the bearish signals from multiple technical indicators, it is advisable to exercise caution and consider potential short-selling or wait for a more favorable entry point before considering a long position in the stock. Monitoring the price action closely in the coming days is crucial to validate the predicted downward movement.