Technical Analysis of PRFX 2024-05-10
Overview:
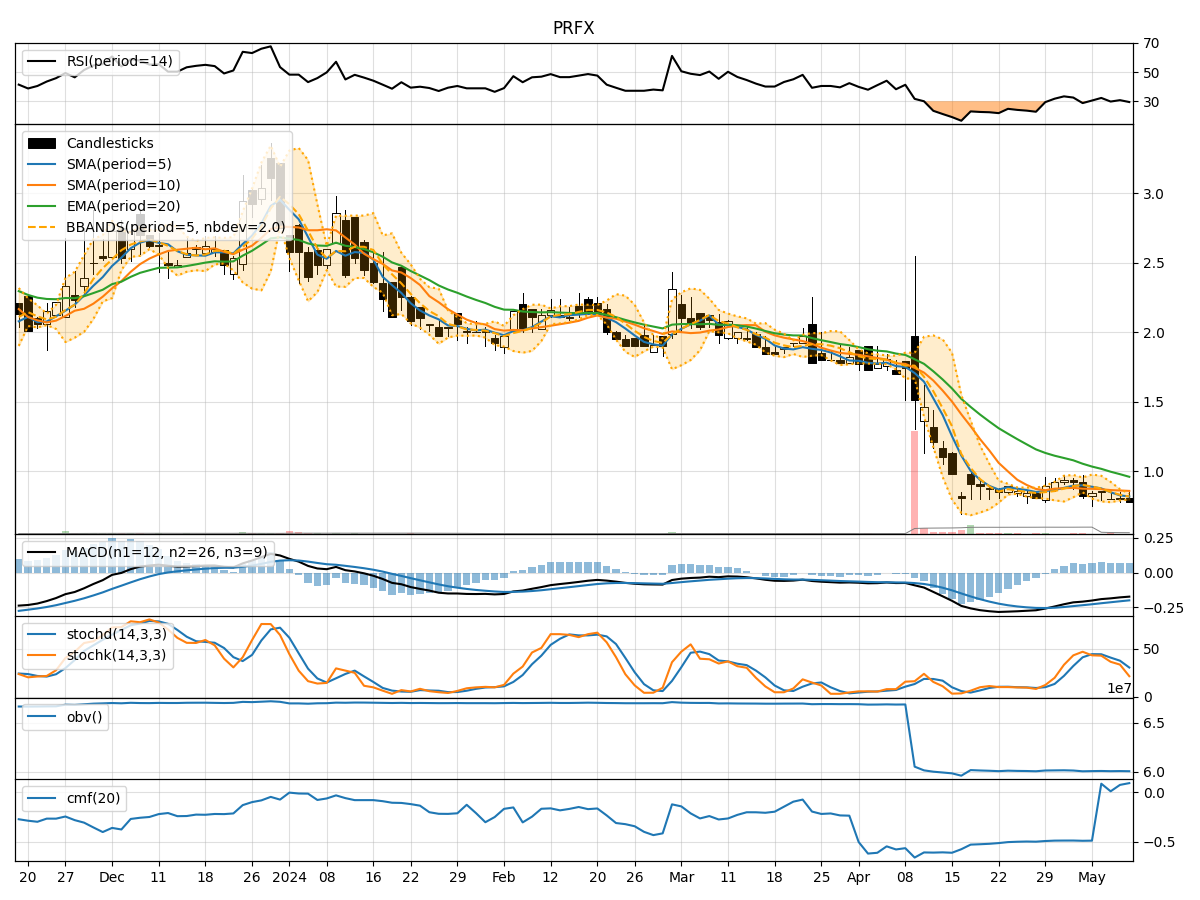
In analyzing the technical indicators for PRFX over the last 5 days, we will delve into the trend, momentum, volatility, and volume indicators to provide a comprehensive assessment of the stock's potential price movement. By examining these key factors, we aim to offer valuable insights and predictions for the upcoming days.
Trend Analysis:
- Moving Averages (MA): The 5-day MA has been consistently below the closing price, indicating a short-term bearish trend.
- MACD: The MACD line has been negative, suggesting a bearish momentum in the stock's price movement.
- EMA: The EMA has been declining, further supporting the bearish trend in the stock.
Key Observation: The trend indicators point towards a downward trend in the stock price.
Momentum Analysis:
- RSI: The RSI has been hovering around the oversold territory, indicating a potential reversal or continuation of the downtrend.
- Stochastic Oscillator: Both %K and %D have been decreasing, signaling a bearish momentum.
- Williams %R: The indicator has been in the oversold region, suggesting a potential reversal in the stock's price.
Key Observation: The momentum indicators reflect a bearish sentiment in the stock.
Volatility Analysis:
- Bollinger Bands (BB): The stock price has been trading below the lower Bollinger Band, indicating oversold conditions.
- Bollinger %B: The %B is below 0.2, suggesting a potential bounce back in the stock price.
- Average True Range (ATR): The ATR has been relatively low, indicating decreased volatility in the stock.
Key Observation: The volatility indicators hint at a possible reversal or consolidation in the stock price.
Volume Analysis:
- On-Balance Volume (OBV): The OBV has been declining, indicating selling pressure in the stock.
- Chaikin Money Flow (CMF): The CMF has been positive, suggesting some buying interest in the stock.
Key Observation: The volume indicators show a mixed sentiment in the stock.
Conclusion:
Based on the analysis of trend, momentum, volatility, and volume indicators, the overall outlook for PRFX in the next few days appears to be bearish. The trend indicators, momentum signals, and volume analysis all point towards a continued downward movement in the stock price. However, the volatility indicators suggest a potential reversal or consolidation in the near term.
Key Conclusion: The stock is likely to experience further downside in the coming days, with a possibility of a short-term bounce back based on volatility indicators. Traders should exercise caution and consider risk management strategies in their trading decisions.