Technical Analysis of POET 2024-05-10
Overview:
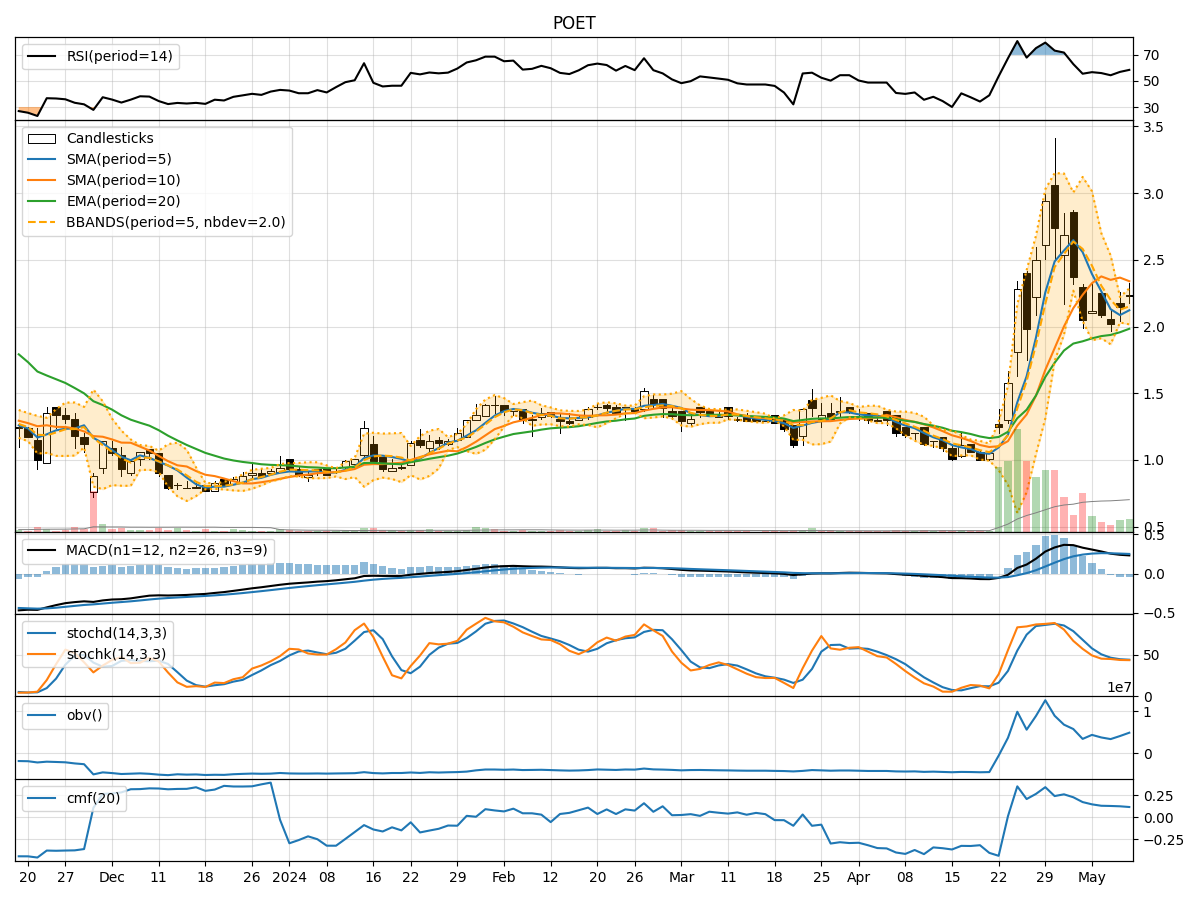
In analyzing the technical indicators for POET stock over the last 5 days, we will delve into the trends, momentum, volatility, and volume indicators to provide a comprehensive outlook on the possible stock price movement in the coming days. By examining key metrics such as moving averages, MACD, RSI, Bollinger Bands, and OBV, we aim to offer valuable insights and predictions for potential price action.
Trend Indicators:
- Moving Averages (MA): The 5-day MA has been consistently below the closing prices, indicating a downward trend.
- MACD: The MACD line has been positive but decreasing, while the MACD Histogram has been negative, suggesting a weakening bullish momentum.
- EMA: The EMA has been gradually increasing, reflecting a potential reversal in the downtrend.
Momentum Indicators:
- RSI: The RSI has been fluctuating around the 50 level, indicating indecision in the market.
- Stochastic Oscillator: Both %K and %D have been declining, signaling a potential bearish momentum.
- Williams %R: The indicator has been hovering in the oversold territory, suggesting a possible reversal to the upside.
Volatility Indicators:
- Bollinger Bands: The bands have been narrowing, indicating decreasing volatility and a potential breakout in the near future.
- Bollinger %B: The %B indicator has been fluctuating around the middle band, suggesting a period of consolidation.
Volume Indicators:
- On-Balance Volume (OBV): The OBV has been relatively flat, indicating a balance between buying and selling pressure.
- Chaikin Money Flow (CMF): The CMF has been slightly positive, suggesting some accumulation in the stock.
Key Observations:
- The stock is currently in a consolidation phase, as indicated by the narrowing Bollinger Bands and flat OBV.
- Momentum indicators are mixed, with RSI showing indecision, Stochastic indicating bearish momentum, and Williams %R hinting at a potential reversal.
- The EMA and MACD suggest a possible reversal in the downtrend, while the MA indicates a continued downward bias.
Conclusion:
Based on the analysis of the technical indicators, the stock price is likely to continue its consolidation phase in the near term. However, there are signs of a potential reversal in the downtrend, supported by the EMA and MACD indicators. Traders should closely monitor the breakout of the Bollinger Bands for a clearer direction. Overall, the outlook for the next few days is neutral with a slight bullish bias.