Technical Analysis of PMEC 2024-05-10
Overview:
In analyzing the technical indicators for PMEC over the last 5 days, we will delve into the trend, momentum, volatility, and volume indicators to provide a comprehensive assessment of the stock's potential price movement. By examining these key factors, we aim to offer valuable insights and predictions for the next few days.
Trend Analysis:
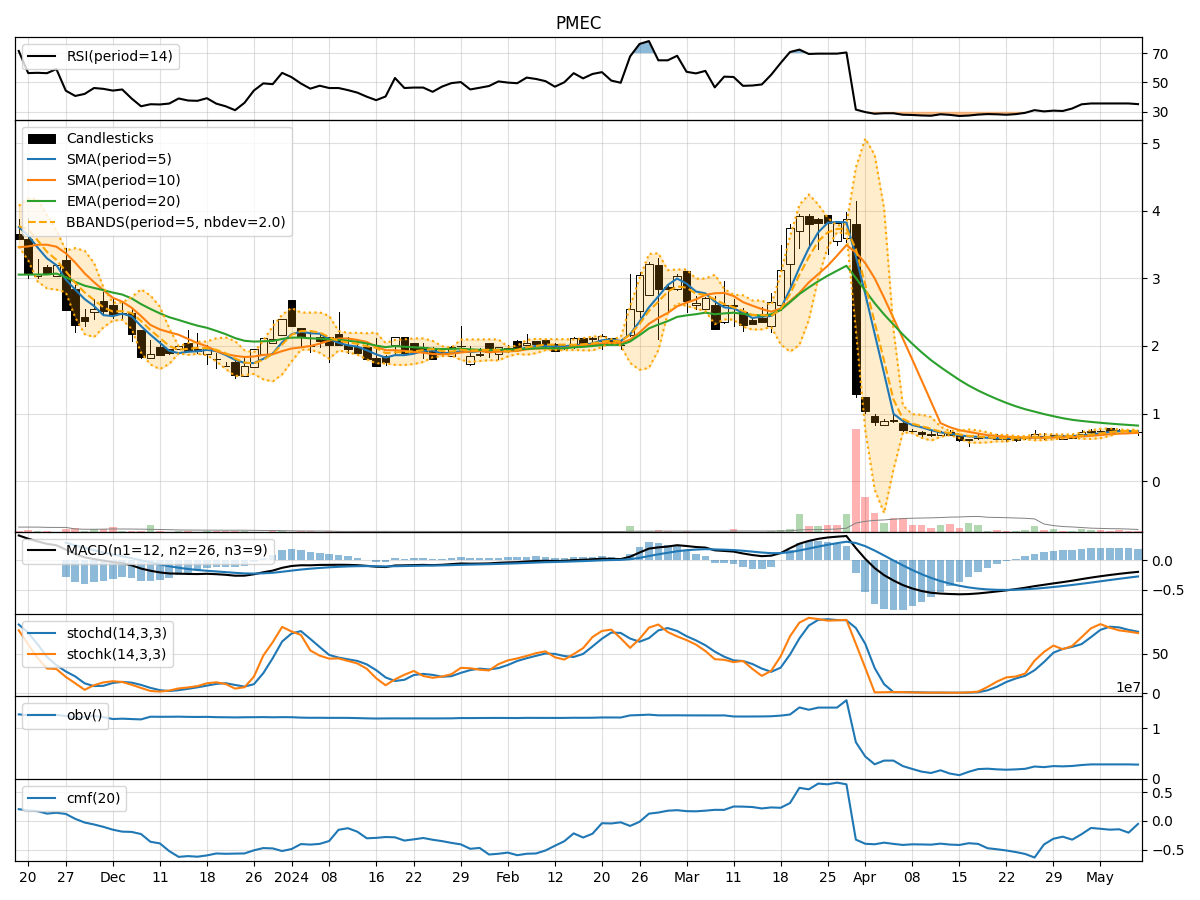
- Moving Averages (MA): The 5-day Moving Average (MA) has been consistently above the Simple Moving Average (SMA) and Exponential Moving Average (EMA) over the past 5 days, indicating a bullish trend.
- MACD: The Moving Average Convergence Divergence (MACD) has shown a positive trend with the MACD line consistently above the Signal line, suggesting bullish momentum in the stock price.
Momentum Analysis:
- RSI: The Relative Strength Index (RSI) has been hovering around 35-36, indicating neutral momentum in the stock.
- Stochastic Oscillator: Both %K and %D have been gradually decreasing but still above the oversold threshold, suggesting a potential reversal in the stock price.
Volatility Analysis:
- Bollinger Bands (BB): The Bollinger Bands have been narrowing, indicating decreasing volatility and a potential price breakout in the near future.
Volume Analysis:
- On-Balance Volume (OBV): The OBV has been relatively stable, indicating neutral volume flow in the stock.
- Chaikin Money Flow (CMF): The CMF has been negative, suggesting selling pressure in the stock.
Key Observations:
- The trend indicators suggest a bullish bias in the stock price, supported by the positive MACD and moving averages.
- Momentum indicators show neutral momentum with a potential for a reversal based on the Stochastic Oscillator.
- Volatility indicators point towards a potential breakout as the Bollinger Bands narrow.
- Volume indicators indicate neutral volume flow with a slight selling pressure based on the CMF.
Conclusion:
Based on the analysis of the technical indicators, the next few days' possible stock price movement for PMEC is likely to be upward with a potential for a bullish breakout. Traders and investors may consider entering long positions or holding onto existing positions to capitalize on the expected price appreciation. However, it is essential to monitor the indicators closely for any signs of reversal or increased selling pressure.