Technical Analysis of PLUR 2024-05-10
Overview:
In analyzing the technical indicators for PLUR stock over the last 5 days, we will delve into the trend, momentum, volatility, and volume indicators to provide a comprehensive outlook on the possible stock price movement in the coming days. By examining these key indicators, we aim to offer valuable insights and predictions for potential investors.
Trend Indicators:
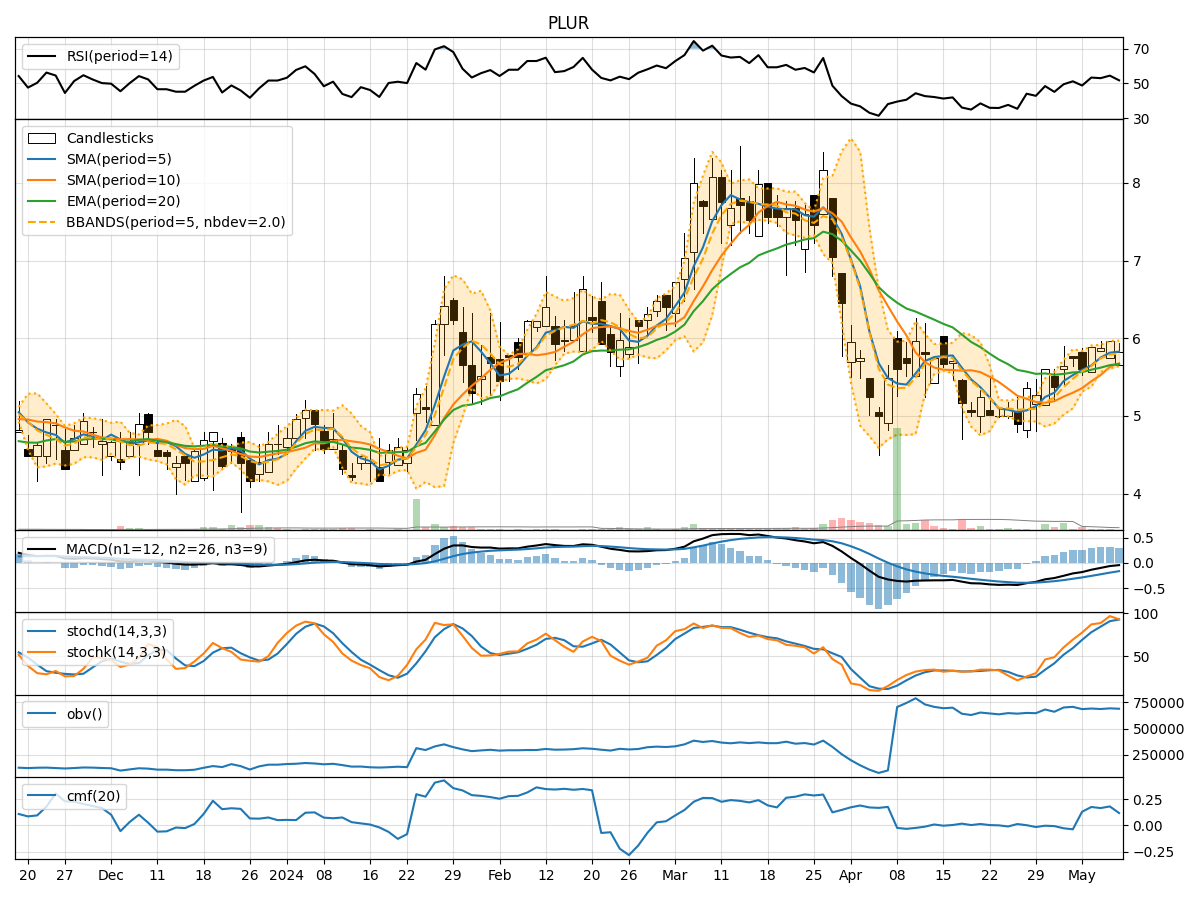
- Moving Averages (MA): The 5-day moving average has been consistently above the simple moving average (SMA) and exponential moving average (EMA), indicating a bullish trend.
- MACD: The MACD line has been consistently below the signal line, suggesting a bearish trend.
- MACD Histogram: The histogram has been mostly positive, indicating some bullish momentum.
Momentum Indicators:
- RSI: The Relative Strength Index (RSI) has been fluctuating around the neutral level of 50, indicating a lack of strong momentum.
- Stochastic Oscillator: Both %K and %D have been in overbought territory, suggesting a potential reversal.
- Williams %R: The Williams %R is in oversold territory, indicating a possible buying opportunity.
Volatility Indicators:
- Bollinger Bands: The stock price has mostly stayed within the bands, showing moderate volatility.
- Bollinger %B: The %B indicator has fluctuated around the middle range, indicating a balanced volatility level.
Volume Indicators:
- On-Balance Volume (OBV): The OBV has shown slight fluctuations, indicating a balanced buying and selling pressure.
- Chaikin Money Flow (CMF): The CMF has been positive, suggesting a bullish money flow into the stock.
Key Observations:
- The trend indicators suggest a mixed signal with the moving averages indicating a bullish trend, while the MACD signals a bearish trend.
- Momentum indicators show a lack of strong momentum, with the RSI hovering around the neutral level.
- Volatility indicators point towards moderate volatility with the stock price mostly staying within the Bollinger Bands.
- Volume indicators indicate a balanced buying and selling pressure with a positive money flow into the stock.
Conclusion:
Based on the analysis of the technical indicators, the stock price of PLUR is likely to experience sideways movement in the next few days. The conflicting signals from trend indicators and the lack of strong momentum suggest a period of consolidation. Investors should exercise caution and wait for clearer signals before making significant trading decisions.